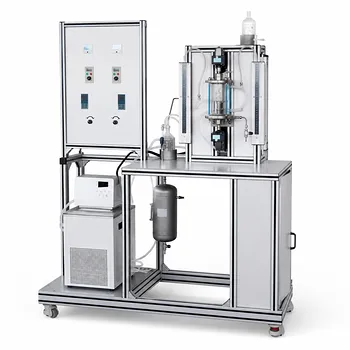
The most direct and rigorously quantitative way to determine the volumetric gas-liquid mass transfer coefficient (kLa) in a pilot-scale reactor is the non-reactive gas uptake method using a pressure decay profile. In this technique, a degassed solvent is contacted with a gas in the headspace under controlled agitation, and the rate of pressure drop is recorded over time. The kLa is then extracted from the slope of a first‑order kinetic plot derived from the pressure data. This approach isolates the physical mass transfer step without interference from chemical reaction kinetics, making it the gold standard for reactor characterization and scale‑up studies.
The pressure decay method turns the reactor itself into a sensitive manometer. By measuring how quickly the headspace pressure falls as gas dissolves into a liquid of known properties, you can calculate the kLa that dictates the rate of gas‑liquid transfer in that exact configuration. This value is the cornerstone for understanding whether your process is mass‑transfer‑limited and for predicting performance at larger scales.
The Gold Standard: Non‑Reactive Gas Uptake with Pressure Decay
The pressure decay method directly measures the rate at which a non‑reactive gas dissolves into a solvent that has been thoroughly degassed. Because no chemical reaction consumes the gas, the entire pressure drop in the closed headspace is due solely to physical absorption. This makes the analysis clean and unambigous.
Step‑by‑Step Procedure
The experimental protocol is simple but demands precision:
- Degas the solvent under vacuum with the agitator running to remove dissolved gases. The solvent must be fully gas‑free to ensure the entire pressure drop comes from the test gas.
- Stop the agitator and introduce the test gas (often hydrogen, nitrogen, or helium) into the reactor headspace until it reaches a pressure close to your target operating point. Then seal the gas inlet.
- Start the agitator at the desired speed and immediately begin recording the headspace pressure with a fast‑response pressure transducer.
- Record the pressure decay until it asymptotically approaches a final equilibrium value (Pf). The approach to equilibrium is what carries the rate information.
The Kinetic Analysis
The pressure curve is fitted to a first‑order rate equation that accounts for the solvent’s vapor pressure and the gas partial pressure. The most commonly used form is:
[ \ln\left(\frac{P_i - P_f}{P - P_f}\right) \cdot \frac{P_f - P_0}{P_i - P_0} = (k_L a), t ]
where:
- (P_i) = initial total pressure after gas introduction
- (P_f) = final equilibrium pressure
- (P_0) = solvent vapor pressure at the operating temperature
- (P) = pressure at time (t)
A plot of the left‑hand side against time yields a straight line whose slope is the volumetric mass transfer coefficient, (k_La). This single number characterizes the mass transfer efficiency for that specific set of conditions.
Critical Assumptions for Accurate Measurement
Three conditions must be met for the slope to represent true mass transfer:
- Thermal equilibrium: The gas and liquid must be at the same temperature before agitation starts. A cold gas warming up inside the reactor will create a false pressure increase that obscures the mass transfer signal.
- No chemical reaction: The gas must not react with the solvent. Any consumption alters the final equilibrium pressure and distorts the kinetics.
- Ideal gas behavior in the headspace (or appropriate compressibility corrections) and negligible liquid‑phase resistance from the gas‑liquid interface relative to the film resistance being measured.
Why Pressure Decay? The Physics Behind the Method
Understanding why this method works builds trust in the data and helps diagnose experimental anomalies.
Linking Pressure to Mass Transfer
In a closed gas‑liquid system, the number of moles of gas in the headspace decreases exactly as gas dissolves into the liquid. For an ideal gas at constant temperature, pressure is directly proportional to the moles of gas remaining. Thus, the rate of pressure drop is a direct proxy for the rate of gas‑liquid mass transfer. By monitoring pressure instead of sampling the liquid phase, you obtain a real‑time, integrative view of the entire transfer process with millisecond resolution.
What the Slope Tells You
A steeper slope indicates a higher kLa—meaning faster gas dissolution. Because you measure under mass‑transfer‑limited conditions (no reaction), the slope you obtain isolates the physical capacity of the reactor to move gas into the liquid. This is exactly the parameter you need to calculate the Damköhler number (Da) for a reactive system. If Da > 1, the reaction is mass‑transfer‑limited and the performance will scale with the kLa you have measured.
Factors That Shape Your kLa Value
The kLa is not a universal constant; it is an engineering property of the reactor–system combination. To use it for scale-up, you must understand what drives it.
Agitation and Power Input
The most powerful lever is specific power input (P/V). Higher agitator speed dissipates more energy into the liquid, breaking gas bubbles into smaller sizes and increasing the specific interfacial area (a). Turbulence also thins the liquid film through which the gas must diffuse, increasing the mass transfer coefficient (kL). In practice, kLa correlates with (Pg/VL)^m, where m is typically between 0.4 and 0.7 depending on the liquid medium.
Liquid Properties: Pure Water vs. Ionic Solutions
The composition of the solvent changes the constants dramatically. Van't Riet’s correlation captures this for stirred tank reactors:
[ k_La = b_0 \cdot (P_g/V_L)^m \cdot u_g^n ]
- For pure water: (b_0 = 0.026), (m = 0.4), (n = 0.5)
- For ionic solutions (which suppress bubble coalescence and keep bubble size small): (b_0 = 0.002), (m = 0.7), (n = 0.2)
The nearly threefold increase in the exponent m for ionic media means that doubling the power input increases the kLa far more in a salt solution than in water. If you measure kLa in pure water but plan to run a fermentation broth, you will significantly underestimate the mass transfer capacity.
Reactor Geometry and Sparging
The type of impeller, the presence of baffles, the fill level, and whether a subsurface sparge line is used all affect bubble dispersion and gas holdup. A flat‑blade disc turbine (Rushton) effectively shears gas bubbles, while a subsurface sparger introduces gas directly into the high‑shear zone. The same kLa measurement protocol must be repeated whenever any of these configurations change, because the value is hyper‑sensitive to them.
Understanding the Trade‑offs and Pitfalls
No method is flawless. Being aware of the limitations ensures you do not misinterpret your data or choose the wrong approach.
The Thermal Effect Problem
If the gas introduced from a pressurized cylinder is colder than the liquid, the headspace pressure will initially rise as the gas warms, then fall as absorption proceeds. This creates a false minimum or a lag in the pressure decay curve, making the early‑time data unusable. Mitigation: pre‑thermostat the inlet gas or use a coiled tube submerged in the reactor’s temperature control bath. Always verify that pressure remains stable for a few minutes with no agitation before the test.
Solvent Vapor Pressure Corrections
For volatile solvents at elevated temperatures, the vapor pressure (P0) can be a substantial fraction of the total pressure. Neglecting it leads to an apparent decrease in kLa because the driving force for mass transfer is overestimated. The first‑order equation explicitly includes P0, so you must know it accurately for your solvent at the operating temperature.
When the Method Falls Short
The pressure decay technique is ideal for head‑space‑fed gas‑liquid reactors and batch operations. In a continuously sparged system where gas flows through the reactor and out a vent, a steady‑state mass balance or an oxygen‑uptake dynamic method is more appropriate. Additionally, if you need kLa under highly reactive conditions, you can complement the physical measurement with a chemical probe reaction (e.g., catalytic hydrogenation with excess catalyst) where mass transfer is rate‑limiting, and fit kLa to the gas consumption curve. This gives you the effective kLa under true process conditions, albeit with some additional complexity.
Making the Right Choice for Your Characterization Goal
Your choice of method and the conditions under which you measure kLa should align with how you intend to use the result.
- If your primary focus is scaling up a reactor from lab to pilot: Measure kLa using the pressure decay method with the actual process solvent (or a fluid that mimics its coalescence behavior) and vary power input over the range of interest. Use Van't Riet correlations to extrapolate to larger scales, but confirm with at least one larger vessel.
- If your primary focus is studying mass transfer fundamentals with students: The non‑reactive gas uptake method is ideal because it is safe, purely physical, and yields a clear kinetic plot that connects theory to hands‑on operation. Emphasize the importance of degassing and thermal equilibrium to teach good experimental practice.
- If your primary focus is comparing agitator designs or sparger configurations: Keep the solvent, temperature, and fill level constant, and measure the pressure decay slope for each setup. The kLa will directly rank the configurations for mass transfer efficiency.
- If your primary focus is verifying whether a reaction is mass‑transfer‑limited: Perform a pressure decay test under the exact conditions of the planned reaction (but without the reactive substrate) to get a baseline kLa. Then run the full reaction at varying agitation speeds; if the rate plateaus at high kLa, the reaction is kinetically controlled below a certain Damköhler number.
The pressure decay method is not just a measurement—it is a diagnostic tool that reveals the physics limiting your reactor. Master it, and you will know exactly where to invest your engineering effort.
Summary Table:
| Factor | Effect on $k_La$ | Key Engineering Consideration |
|---|---|---|
| Agitation (P/V) | Higher power input increases interfacial area ($a$) | Primary control lever for mass transfer |
| Liquid Medium | Ionic solutions prevent bubble coalescence | Yields significantly higher $k_La$ than pure water |
| Geometry | Impeller and sparger designs alter bubble dispersion | Must be kept consistent during scale-up studies |
| Temperature | Affects gas solubility and solvent vapor pressure | Requires strict thermal equilibrium to avoid errors |
Scale Up Your Research & Education with LABPARK
Accurate process characterization starts with the right equipment. LABPARK provides high-performance Educational and Vocational Unit Operations Pilot Plants in chemical engineering, bioprocess & biotech, and environmental & water treatment. Designed specifically for universities, research institutes, and enterprises, our pilot systems empower you to master reactor scale-up and $k_La$ determination.
Ready to elevate your laboratory capabilities? Contact us today to discuss your custom pilot plant requirements!
Related Products
- Dual-Drive Stirred Gas-Liquid Mass Transfer Coefficient Determination Pilot Plant
- Liquid-Liquid Mass Transfer Coefficient Determination Educational Pilot Plant
- Absorption and Desorption Educational Unit Operations Pilot Plant
- Carbon Dioxide Absorption and Desorption Educational Pilot Plant for Carbon Capture Studies
- Two Phase Flow Pattern Velocity Resistance Measurement Educational Pilot Plant
People Also Ask
- How does temperature affect mass transfer rates in chemical engineering educational pilot plants?
- How do pilot plants study gas solubility in polymer melts at high pressures? Key Mass Transfer Insights
- How does column packing affect absorption intensification, and how is it evaluated experimentally?
- Why Compare Membrane-Reservoir Models with Pilot Plant Data? Ensure Successful Process Scale-Up
- How does k_La affect hydrogenation scale-up? Critical insights for pilot reactors.