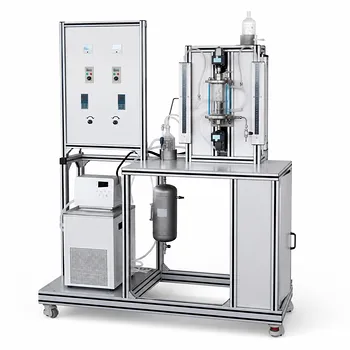
Liquid holdup is the volume fraction of the column’s packing occupied by liquid during operation. In a countercurrent packed column, it is not a single number but the sum of two distinct contributions: static holdup—the liquid that clings to the packing even after drainage stops—and dynamic (or operating) holdup—the liquid voluntarily flowing through the packing. Calculation relies on semiempirical correlations, not a single universal formula, which estimate these values from the liquid’s flow rate, physical properties (density, viscosity, surface tension), and the packing’s geometry (specific surface area, void fraction).
The essential insight for pilot-unit mass transfer work is that liquid holdup directly dictates both the gas–liquid contact area and the liquid’s residence time. Its quantification is therefore the practical bridge between raw hydraulic data and meaningful mass transfer performance.
Why Holdup Is the Hidden Driver of Pilot-Column Performance
You might be measuring concentration profiles or calculating overall mass transfer coefficients, but without an accurate holdup value, those numbers lose physical meaning. Holdup connects the packing’s geometry to the active interfacial area and the time liquid spends in the column—two factors that control separation efficiency.
The Two Faces of Holdup: Static vs. Dynamic
Static holdup is the liquid retained in the packing’s crevices, on surfaces, and in wetted dead zones. It remains behind when the column is drained, and it is largely independent of the gas or liquid flow rates. It depends only on the packing material, surface texture, and the liquid’s ability to wet it.
Dynamic holdup is the liquid that actually moves through the bed. It is highly sensitive to the liquid and gas flow rates, and it is the portion that dictates the column’s hydraulic resistance and the true residence time of the process fluid.
During normal operation, what you measure as total holdup is the sum of these two fractions. In pilot-unit studies, distinguishing between them helps you understand wetting efficiency versus throughput limitations.
How Holdup Defines Interfacial Area and Residence Time
The effective interfacial area for mass transfer is rarely the full geometric surface of the packing. It is a fraction of it, closely tied to how much liquid wets the packing—essentially the dynamic holdup.
Liquid residence time, a critical parameter for kinetic studies and reactions that run alongside absorption or distillation, is directly proportional to the total holdup divided by the liquid volumetric flow rate. A pilot unit with poorly characterized holdup will yield residence times that are guesses, undermining scale-up decisions.
How Liquid Holdup Is Quantified in Practice
There is no single clean equation. Instead, engineers rely on semiempirical correlations developed from decades of laboratory and pilot-plant data. These correlations express holdup in terms of dimensionless groups that capture the interplay of forces.
The Core Inputs of Holdup Correlations
Every widely used correlation—whether from Otake and Kunigita, Shulman et al., or Buchanan—demands the same class of inputs:
- Liquid properties: density, dynamic viscosity, and surface tension. These govern how the liquid spreads, drains, and resists shear.
- Liquid superficial velocity: the velocity the liquid would have in an empty column, which drives dynamic holdup.
- Packing characteristics: the dry specific surface area (a_p) and the bed void fraction (ε). These define the geometry available for liquid to occupy.
- Gas flow rate: often included to account for the counteracting effect of the gas phase on liquid drainage and entrainment (especially near the flooding point).
What the Correlations Actually Predict
The correlations typically deliver a liquid saturation fraction or a direct holdup volume per unit bed volume. For example, a classic form might predict:
Total holdup = f ( Re_L, Ga_L, a_p, ε, and sometimes gas pressure drop)
where Re_L is the liquid Reynolds number and Ga_L the liquid Galileo number, bundling the property effects. In pilot-unit teaching and research, students often compute these dimensionless numbers and then plot holdup against liquid load to identify the loading point and the pre-flooding regime.
Typical Holdup Values and What They Signal
In most well-operated packed columns with random or structured packing, total liquid holdup stays below 6% of the column’s empty volume. This low value is a deliberate design feature: it enables rapid startup, quick stabilization, and fast dynamic response—ideal for a pilot lab where experiments change frequently.
When holdup climbs significantly above this range (e.g., near 10% or higher, depending on packing), it indicates that the column is approaching its hydrodynamic limits, gas pathways are narrowing, and pressure drop is about to escalate exponentially.
Understanding the Trade-offs
Holdup is not a “more is better” or “less is better” variable. It embodies a fundamental tension in packed column operation.
The Downside of Too Much Holdup
Excessive liquid accumulation—often from running at too high a liquid load or near flooding—restricts the open cross-section available for gas flow. This chokes the column: pressure drop surges, capacity plummets, and you risk phase inversion or entrainment that destroys mass transfer efficiency. In a pilot unit, high holdup also erodes one of the key advantages of packed columns over plate columns: their low liquid inventory and short thermal exposure time for heat-sensitive materials.
The Downside of Too Little Holdup
Insufficient holdup, often due to very low liquid rates or poor distributor design, leads to incomplete wetting of the packing. The available interfacial area drops, causing the mass transfer efficiency to fall below what the packing theoretically can achieve. You might get good hydraulic data but poor separation, making the pilot results misleading for scale-up.
The Packed-Column Advantage in Context
Compared to plate columns (which typically exhibit 8–12% liquid holdup), packed columns’ low-holdup nature provides a buffer-free, agile operation. But this also means they are less forgiving of flow-rate disturbances. The pilot unit thus becomes the perfect testbed for understanding how control strategies must compensate for the fast dynamics that come from a small liquid inventory.
How to Apply This to Your Pilot-Unit Work
You calculate holdup not just for a lab report, but to diagnose performance and predict behavior. Your approach should match your operational goal.
- If your primary focus is measuring mass transfer coefficients: Prioritize accurate dynamic holdup measurement, because it determines the effective interfacial area. Use a correlation validated for your specific packing and fluid system, and cross-check with a tracer test for residence time distribution if possible.
- If your primary focus is studying hydraulics or flooding: Track total holdup as a function of gas and liquid loads. Plot the loading curve and identify the inflection point where dynamic holdup begins to rise sharply—this is your operating ceiling.
- If your primary focus is teaching column dynamics: Use the contrast between static and dynamic holdup to explain why columns need a minimum wetting rate and why the same packing can deliver different efficiencies in different service. Let students run drain-down experiments to measure static holdup directly and feel the difference.
- If your primary focus is scale-up: Do not assume holdup fraction stays constant across scales. Correlations have scale-dependent uncertainties; validate your chosen correlation on the pilot unit’s data, then use it to predict the commercial column’s holdup, and hence its required bed height for the same separation.
Knowing your liquid holdup turns your pilot column from a mysterious black box into a predictable, scalable piece of process equipment.
Summary Table:
| Holdup Type | Definition & Operational Impact | Key Influencing Factors |
|---|---|---|
| Static Holdup | Liquid retained in crevices and surfaces after drainage; independent of flow rates. | Packing material, surface texture, liquid wetting properties |
| Dynamic Holdup | Liquid actively flowing through the packing bed; dictates residence time and pressure drop. | Liquid superficial velocity, fluid viscosity, gas flow rate |
| Total Holdup | The sum of static and dynamic holdup (typically keeps below 6% of column empty volume). | Bed void fraction, packing specific surface area, fluid density |
Bring Precision to Your Mass Transfer Operations
Optimizing liquid holdup and analyzing column dynamics requires reliable, highly accurate process equipment. LABPARK provides premium Educational and Vocational Unit Operations Pilot Plants in chemical engineering, bioprocess & biotech, and environmental & water treatment for universities, research institutes, and enterprises.
Our pilot plants are engineered to help students, researchers, and engineers accurately measure parameters like liquid holdup, pressure drop, and absorption efficiency to bridge the gap between theory and industrial scale-up.
Ready to elevate your laboratory's capabilities? Contact us today to explore our customizable pilot plant solutions!
Related Products
- Absorption and Desorption Educational Unit Operations Pilot Plant
- Multimodal Absorption and Desorption Pilot Plant for Unit Operations Training
- High-Gravity Emulsification and Mass Transfer Educational Pilot Plant
- Dual-Mode Rectification Pilot Plant for Practical Training Unit Operations
- Packed Bed Absorption Educational Unit Operations Pilot Plant
People Also Ask
- How to demonstrate physical vs chemical absorption using a pilot plant? A practical lab guide.
- Why are liquid-phase mass transfer rates in pilot plants comparable to gas-phase rates? Key Insights
- Why is interface composition critical in absorption pilot plants? Bridging Theory & Practice
- How do absorption pilot plants assist students in calculating mass transfer coefficients and sizing column parameters?
- How to Calculate HTU & NTU for Pilot Plant Packing Height: A Complete Guide