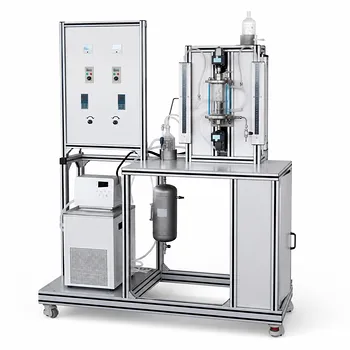
The parameters to accurately estimate $k_L a$ in a bubble column pilot unit extend far beyond a simple checklist; they form the physical identity of your two-phase flow. To estimate this critical coefficient, researchers must simultaneously monitor the column diameter ($d_c$), superficial gas velocity ($u_g$), fractional gas holdup ($\epsilon_g$), and the fundamental liquid properties like viscosity ($\mu_L$), surface tension ($\sigma_L$), and the liquid diffusion coefficient ($D_L$).
Simply knowing which physical properties affect $k_L a$ is not enough to get a valid pilot-plant number. The true challenge is recognizing that these parameters are meaningless unless validated under conditions where the measurement itself is rate-limited by mass transfer, not by macro-mixing or thermal artifacts.
The Parameters at the Heart of the Bubble Column Model
Estimating $k_L a$ from empirical correlations—like the classic Akita and Yoshida model—requires rigorous control of geometric and material properties. These parameters dictate the flow regime and the resulting interfacial area.
The Geometric Dictators: Column Size and Gas Flow
The column diameter ($d_c$) is not just a dimension; it’s a regressor that defines the scale-up boundary. The Akita and Yoshida correlation is explicitly valid only within a specific range ($0.15 < d_c < 0.6 , \text{m}$).
Monitoring this ensures your pilot unit actually represents the physics of a small industrial column, not a lab-scale beaker.
The superficial gas velocity ($u_g$) is the primary driver of turbulence and holdup.
You must keep it below the correlation’s limit (typically $u_g < 0.33 , \text{m/s}$) to avoid transitioning into a slug-flow regime that invalidates classical mass-transfer models.
The Physical Property Triad
The liquid’s physical state determines the resistance on the liquid side of the interface.
- Liquid Viscosity ($\mu_L$): High viscosity dampens turbulence, leading to larger bubbles and a lower specific interfacial area ($a$). It also slows molecular diffusion.
- Surface Tension ($\sigma_L$): Surface tension governs bubble coalescence. Lower surface tension promotes smaller, more stable bubbles, directly increasing the specific interfacial area ($a$).
- The Liquid Diffusion Coefficient ($D_L$): This is the molecular speed limit. Even with perfect interfacial area, $k_L$ is fundamentally proportional to $\sqrt{D_L}$, making this thermodynamic property a mandatory input for predictive models.
The Composite Performance Indicator: Gas Holdup
Fractional gas holdup ($\epsilon_g$) is the macroscopic outcome of the interaction between all the above parameters.
It’s the direct gateway to calculating the specific interfacial area. You cannot estimate $k_L a$ without accurately measuring the volume fraction of gas currently residing in the liquid phase.
The Critical Bridge: Measuring $k_L a$ Reliably
Monitoring the physical parameters is only half the battle. To generate a valid pilot-plant correlation, the experimental methodology must fit the rate-limiting step.
Ensuring Mass Transfer is the Bottleneck
A devastating mistake in pilot units is measuring gas uptake that is actually limited by macro-mixing or thermal lag.
You must operate under conditions where gas-liquid mass transfer is the unambiguous rate-limiting step. This often requires running a reaction with high catalyst loading or using a physical absorption method.
The Pressure Decay Method
A rigorous way to calculate $k_L a$ is the non-reactive gas uptake technique. You degas the solvent, introduce gas to the headspace, and then track the pressure drop.
The first-order rate equation used here, $\ln[(P_i - P_f)/(P - P_f)] \cdot (P_f - P_0)/(P_i - P_0) = (k_La)t$, depends on highly accurate pressure readings.
Therefore, you must continuously monitor headspace pressure and temperature with a fast-response transducer. The gas and liquid must be at thermal equilibrium before starting, or the resulting pressure recovery from thermal effects will contaminate your mass transfer data.
Common Pitfalls to Avoid
Over-reliance on empirical correlations without measuring the underpinning variables leads to massive scale-up failure.
Ignoring Sparger and Baffle Design
A standard correlation assumes a specific back-mixing profile, but the design of your gas sparger heavily skews the results.
If you switch from a porous plate to a single-orifice sparger without tracking the resulting change in the Sauter mean bubble diameter ($d_{vs}$), your interfacial area estimate collapses.
The Startup Artifact
A lack of thermal equilibrium is the most common silent error.
If you start the agitator for an uptake test while the gas headspace is warmer than the liquid bulk, the cooling gas creates a falling pressure curve that mimics rapid mass transfer. Always delay logging until thermal transients have decayed.
Making the Right Choice for Your Goal
Apply this diagnostic framework based on your primary objective:
- If your primary focus is validating a scale-up correlation: Precisely document your column diameter, superficial gas velocity, and liquid transport properties to ensure your pilot unit operates strictly within the model’s boundaries.
- If your primary focus is bioreactor optimization for gas holdup: Focus your monitoring on dynamic surface tension and sparger design, as these will define your oxygen transfer ceiling far more than a slight change in viscosity.
- If your primary focus is fitting intrinsic chemical kinetics: You must run the non-reactive uptake test and monitor the pressure-decay curve under the exact same mixing configuration, ensuring mass transfer is the true bottleneck.
The key to an accurate $k_L a$ estimate is realizing that the parameter is not a universal constant, but a snapshot of a specific geometric and thermodynamic state that you must fully measure to repeat.
Summary Table:
| Parameter | Impact on $k_L a$ | Key Considerations |
|---|---|---|
| Column Diameter ($d_c$) | Defines scale-up boundary | Must align with correlation limits (e.g., $0.15 < d_c < 0.6$ m). |
| Superficial Gas Velocity ($u_g$) | Drives turbulence & gas holdup | Keep below transition limits (typically $< 0.33$ m/s) to avoid slug flow. |
| Liquid Physical Properties | Affects bubble size & diffusion | Viscosity ($\mu_L$), surface tension ($\sigma_L$), and diffusion ($D_L$) dictate resistance. |
| Fractional Gas Holdup ($\epsilon_g$) | Direct link to interfacial area | Essential composite indicator for estimating total bubble surface area. |
Achieve Precise Scale-Up Results with LABPARK
Accurately estimating mass transfer parameters like $k_L a$ requires robust, high-fidelity experimental setups. LABPARK delivers state-of-the-art Educational and Vocational Unit Operations Pilot Plants tailored for chemical engineering, bioprocess & biotech, and environmental & water treatment applications.
Whether you are a university, research institute, or enterprise, our pilot units provide the precise geometric controls and monitoring capabilities needed for reliable, repeatable research.
Contact LABPARK today to find the perfect pilot plant solution for your lab!
Related Products
- Liquid-Liquid Mass Transfer Coefficient Determination Educational Pilot Plant
- Absorption and Desorption Educational Unit Operations Pilot Plant
- Dual-Drive Stirred Gas-Liquid Mass Transfer Coefficient Determination Pilot Plant
- Dual-Mode Rectification Pilot Plant for Practical Training Unit Operations
- Pressure Swing Adsorption Educational Unit Operations Pilot Plant
People Also Ask
- Why Compare Membrane-Reservoir Models with Pilot Plant Data? Ensure Successful Process Scale-Up
- How does column packing affect absorption intensification, and how is it evaluated experimentally?
- What are the limitations of the Wilke-Chang correlation? Avoid critical mass transfer errors.
- What is the role of the Sherwood number ($Sh$) in pilot plants? Master mass transfer scale-up
- Why is the calculation of gas and liquid diffusion coefficients critical? Unlock Accurate Pilot Plant Scale-Up