Here is the foundational link every pilot plant data analyst must know: the solubility coefficient (H) and Henry's coefficient (E) are inversely related. For the dilute solutions typical of pilot plant operations, this relationship is (H \approx \rho / (E M_s)), where (\rho) is the solvent density and (M_s) its molar mass.
In dilute solution pilot plant analysis, the solubility coefficient (H) is defined by (H \approx \rho/(M_s E)). Because Henry's coefficient (E) rises with increasing temperature, (H) falls—so hotter solvents dissolve less gas. This inverse link is the core of all temperature-dependent absorption and stripping data interpretation.
The Mathematical Link Between (H) and (E)
Two Sides of the Same Equilibrium
Henry's law can be expressed in two common ways, leading to the two coefficients you encounter in pilot plant data. The standard Henry's coefficient (E) (kPa) links gas partial pressure (p_A) to liquid mole fraction (x_A):
(p_A = E , x_A).
The solubility coefficient (H) (kmol/(m³·kPa)) directly relates liquid concentration (C_A) (kmol/m³) to partial pressure:
(C_A = H , p_A).
From Mole Fraction to Concentration: The Role of Solvent Properties
The bridge between them is the solvent’s molar density. For a dilute solution, the total liquid molar concentration is approximately (\rho / M_s).
Since (C_A = x_A (\rho / M_s)), substituting (x_A = p_A / E) gives:
(C_A = (\rho / M_s) \cdot (1/E) \cdot p_A).
Thus, by inspection, (H = \rho / (M_s E)). This conversion is essential when your pilot plant’s analytical instruments measure mole fractions (giving (E)) but your mass‑transfer models require concentrations (needing (H)).
How Temperature Shifts the Equilibrium
The Thermodynamic Driver
Henry's coefficient (E) is not constant—it is strongly temperature‑dependent. As temperature rises, the escaping tendency of the gas increases, and (E) increases.
Because (H) is inversely proportional to (E), an increase in temperature causes (H) to decrease. This quantifies the familiar rule: gas solubility falls with rising temperature.
Quantifying the Shift in a Pilot Plant
In a well‑instrumented pilot plant, you can measure this directly. By using heat exchangers to change the inlet solvent temperature and recording the outlet gas and liquid compositions, you calculate (E) at each temperature.
Then, plotting (H) against temperature (via the inverse relation) reveals the solubility curve. This allows you to validate thermodynamic models and to select the correct (H) for your unit operation at the actual operating temperature—not just at the standard conditions listed in reference tables.
Pilot Plant Application: From Data to Design
Why This Relation Matters for Your Analysis
When processing pilot plant data, you often receive (E) from a lab measurement or a simulation output. Using (H \approx \rho/(M_s E)) lets you translate that into the volumetric mass‑transfer coefficient ((k_La)) calculations that govern column sizing.
Without this step, your mass balance and scaling predictions will be off if the experimental temperature differs from the reference temperature.
The “Large H, Small H” Heuristic
The primary reference gives a simple rule of thumb that directly reflects this relationship:
- Highly soluble gases (like ammonia) produce a large (H) (small (E))
- Poorly soluble gases (like oxygen) yield a small (H) (large (E))
This tells you immediately whether absorption will be easy or difficult in your pilot trial.
Understanding the Trade‑offs and Limitations
The Dilute Solution Assumption
The formula (H \approx \rho/(M_s E)) is exact only for infinitely dilute solutions. At higher solute concentrations, the solvent’s molar density changes, and the activity coefficient deviates from unity.
If your pilot plant handles moderately concentrated streams, using this simple conversion introduces increasing error—you may need to incorporate activity‑coefficient corrections.
Neglect of Salting‑Out Effects
The relationship does not account for dissolved electrolytes. As supplementary references note, the salting coefficient (h_g) itself changes with temperature, altering the effective solubility beyond the simple (H)‑(E) inversion.
In wastewater or brine‑processing pilot plants, ignoring this can lead to significant over‑prediction of absorbed gas, necessitating additional corrections.
Density and Molar Mass Variability
The solvent density (\rho) and molar mass (M_s) are themselves mild functions of temperature. For high‑accuracy mass balances across wide temperature ranges, using constant values for (\rho) and (M_s) introduces a small systematic error.
However, for most educational and industrial pilot plant work, this effect is negligible compared to the exponential change in (E) with temperature.
Making the Right Choice for Your Goal
Your specific pilot plant objective determines exactly how you should use the (H \leftrightarrow E) relationship and temperature data.
- If your primary focus is scaling up an absorption column: Always convert your measured (E) to (H) at the exact liquid temperature your full‑scale unit will reach. Use the highest‑accuracy solvent density and molar mass for that temperature.
- If your primary focus is stripping or degassing: Recognise that elevating temperature reduces (H), making gas removal dramatically more efficient. Plot (H) vs. temperature to identify the minimum economically viable heating load.
- If your primary focus is model validation in a teaching pilot plant: Have students calculate both (E) and (H) from the same experimental run at multiple temperatures. Plotting (1/H) vs. (E) verifies the linear relationship predicted by the equation, reinforcing the underlying physical chemistry.
- If your primary focus is processing saline or complex solutions: Supplement the simple (H \approx \rho/(M_s E)) conversion with temperature‑adjusted salting coefficients to avoid under‑predicting the required tower height.
The single, inverse relationship between (H) and (E) unlocks the entire temperature‑dependent behaviour of your pilot plant’s gas‑liquid system—once you master this conversion, every data point tells you exactly how solubility dictates your process efficiency.
Summary Table:
| Parameter | Formula / Relationship | Temperature Rise Effect | Pilot Plant Application |
|---|---|---|---|
| Henry's Coefficient ($E$) | $p_A = E \cdot x_A$ | Increases | Measures gas escaping tendency; useful when analytical tools measure mole fractions. |
| Solubility Coefficient ($H$) | $C_A = H \cdot p_A \approx \frac{\rho}{M_s E}$ | Decreases | Directly used in volumetric mass-transfer ($k_L a$) calculations for column sizing. |
Maximize Your Pilot Plant Precision with LABPARK
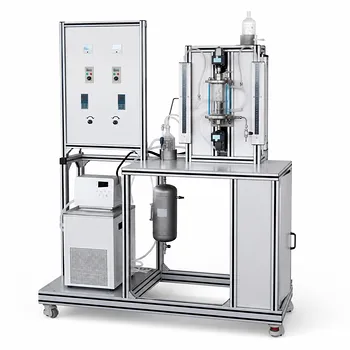
Accurate data interpretation starts with reliable, industry-grade hardware. LABPARK provides state-of-the-art Educational and Vocational Unit Operations Pilot Plants in chemical engineering, bioprocess & biotech, and environmental & water treatment.
Designed specifically for universities, research institutes, and enterprises, our pilot plants allow you to validate thermodynamic models, measure temperature-dependent solubility shifts, and scale up processes with confidence.
Ready to elevate your research and teaching capabilities? Contact LABPARK today to find the ideal pilot plant solution for your facility!
Related Products
- Comprehensive Heat Transfer Coefficient Determination Educational Unit Operations Pilot Plant
- Liquid-Liquid Mass Transfer Coefficient Determination Educational Pilot Plant
- Solid Spherical Heat Transfer Coefficient Determination Educational Chemical Engineering Pilot Plant
- Carbon Dioxide PVT Curve Determination Educational Unit Operations Pilot Plant
- Educational Compression Refrigeration Performance Determination Unit Operations Pilot Plant
People Also Ask
- When is ε-NTU preferred over LMTD in pilot plants? Predict heat exchanger performance without iteration.
- How do unit conversions affect pilot plant calibration? Avoid errors in heat transfer data analysis
- Why is the prevention of scale formation on heat exchanger surfaces a critical learning objective? Key Lessons
- How does thermal conductivity affect pilot plant performance? Optimize heat transfer & accuracy
- What engineering trade-offs must students analyze in a heat transfer pilot plant? Balance performance & cost.