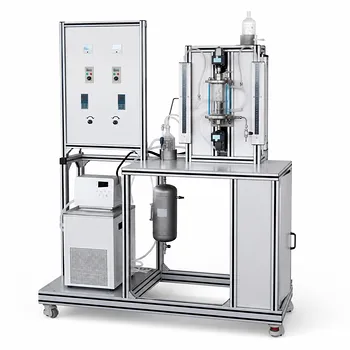
Gas-liquid reaction regimes are defined by where the reaction occurs relative to the mass-transfer film. In slow regimes, the reaction is so gradual that conversion happens mainly in the bulk liquid. In fast regimes, the chemical transformation is completed inside the thin liquid film adjacent to the gas-liquid interface. A dimensionless reaction factor (M) ( (M = \frac{D_L k_1}{k_L^2}) ) quantifies this behavior: (M \ll 1) indicates a slow regime, while (M \gg 1) signals a fast regime. Chemical engineering pilot plants let you manipulate temperature, agitation, and catalyst concentration to intentionally shift (M), then measure inlet/outlet concentrations to verify which model dominates.
The core insight: The reaction factor (M) determines whether reactor design should prioritize liquid hold‑up (slow regime) or interfacial area (fast regime). By operating a gas‑liquid CSTR pilot plant and measuring concentration changes under controlled conditions, you can compute (M) directly and confirm whether the system indeed follows slow or fast regime assumptions—turning abstract models into tangible, verifiable knowledge.
The Reaction Factor (M) as the Deciding Parameter
The value of (M) tells you where the chemical reaction physically takes place, which cascades into every design and scale‑up decision.
How (M) Defines Reaction Location
(M) compares the time a molecule needs to diffuse across the liquid film to the time required for reaction. When (M) is very small, diffusion is fast relative to reaction, so the reactant has plenty of time to leave the film and react in the bulk. When (M) is very large, the molecule reacts before it can escape the film, confining the reaction to a thin interfacial zone.
The Physical Interpretation of Slow vs. Fast
A slow regime ((M \ll 1)) means the reaction rate is the bottleneck, not mass transfer. A fast regime ((M \gg 1)) means the mass transfer rate is the bottleneck—the liquid film acts like a reactor where the reaction is practically instantaneous relative to diffusion.
How This Distinction Alters Reactor Design
For a slow reaction, the total conversion depends on how much liquid is present and how long it stays in the reactor. For a fast reaction, conversion depends on how much gas‑liquid contact area you provide. Choosing the wrong vessel type for the regime leads to oversized equipment, poor selectivity, or runaway absorber costs.
The Two Regimes in a Gas‑Liquid CSTR
A well‑mixed CSTR makes the bulk liquid composition uniform, which simplifies modeling and experimentation. This uniformity lets you isolate the core difference between slow and fast behavior.
The Slow Reaction Regime
Here the liquid film contributes virtually no conversion. Reaction takes place entirely in the bulk liquid with a concentration that is effectively the same everywhere. The absorption rate is simply the physical mass‑transfer rate driven by the concentration gradient between the interface and the bulk, and the reactor volume must be large enough to give the slow kinetics sufficient residence time.
The Fast Reaction Regime
The reaction is so rapid that the dissolved gas is consumed inside the diffusion film. Absorption is enhanced because the concentration of the dissolved gas drops steeply within the film, steepening the driving force. The bulk liquid concentration of the gaseous reactant may approach zero; the bulk plays only a storage role for the liquid‑phase reactant.
The Transition Between Regimes
By gradually increasing temperature or catalyst loading, you can watch a system cross from slow to fast. The visible sign is a jump in the absorption rate that cannot be explained by physical mass transfer alone—the enhancement factor suddenly becomes significant. Pilot plants capture this transition by showing that the outlet gas composition changes sharply for the same reactor volume.
How Pilot Plants Let You Investigate These Regimes Experimentally
A gas‑liquid CSTR pilot plant turns the theoretical (M) concept into a measurable quantity. You can intentionally move the system across regimes and record the consequences.
Manipulating (M) with Operating Variables
- Temperature changes the kinetic constant (k_1), often by orders of magnitude. A 10 K rise can double the reaction rate and raise (M) proportionally.
- Agitation speed alters the liquid‑side mass‑transfer coefficient (k_L) and the interfacial area (a). Higher speed decreases the film thickness, reducing the diffusion time and therefore lowering (M) if all else is constant.
- Catalyst concentration (or liquid reactant concentration) directly multiplies the effective first‑order constant (k_1), shifting (M) up or down. By holding all variables except one fixed, you can sweep (M) from (< 0.1) to (> 10) and observe the regime change.
Switching Reactor Configuration to Match the Regime
A multi‑functional pilot plant allows you to exchange the CSTR for a packed column or a bubble column. For a fast reaction ((M \gg 1)), a packed column maximizes interfacial area per unit volume, giving dramatically higher absorption rates than a stirred tank with limited area. For a slow reaction ((M \ll 1)), a stirred tank or bubble column provides the large liquid holdup needed to reach conversion. Running the same chemistry in both configurations verifies that the design rule—area for fast, volume for slow—holds quantitatively.
Data Analysis to Verify Regime Models
With inlet and outlet gas‑phase concentrations and liquid‑phase compositions measured at steady state, you can:
- Calculate the physical mass‑transfer coefficient in a non‑reactive absorption experiment.
- Run the reaction and measure the actual absorption rate.
- Extract the enhancement factor, then back‑calculate (M) from known film‑theory expressions (e.g., (E \approx \sqrt{M}) for a pseudo‑first‑order fast regime). If the computed (M) is far below 1 and the bulk liquid is saturated or near‑saturated, the reaction is slow; if (M \gg 1) and the bulk liquid shows negligible dissolved gas, the fast‑regime model is confirmed. This direct validation grounds the theoretical equations in plant‑scale data.
Understanding the Trade‑offs and Common Pitfalls
No experimental setup is perfect. Recognizing the limitations of pilot‑plant investigations prevents misinterpretation.
The Trap of Assuming a Single Controlling Regime
In a CSTR, part of the liquid film may experience a locally high (M) while the bulk remains in a slow regime. Mixing models can oversimplify and label the whole reactor as one regime. Always check whether the measured enhancement matches the regime you assume across the entire reactor volume.
The Influence of Gas‑Side Resistance
For very fast reactions, the gas‑phase transport resistance may no longer be negligible. If the gas‑film resistance dominates, increasing agitation speed will have little effect on the absorption rate, hiding the true (M) value. Pilot‑plant protocols must include pure‑gas or high‑gas‑velocity tests to isolate liquid‑side control.
Scale‑Up Risks from Pilot Data Alone
A pilot‑plant CSTR has different interfacial area‑to‑volume ratios and mixing times than a full‑scale unit. A regime that appears fast in a small, intensely agitated vessel may shift toward slow in a large, less‑sheared industrial tank. Always use the pilot data to extract the intrinsic kinetic and mass‑transfer parameters separately, then re‑compute (M) at plant‑scale conditions.
Making the Right Choice for Your Investigation Goals
Whether you are teaching a unit operations lab or developing a new process, pilot‑plant experiments should align with the regime you expect to dominate at scale.
- If your primary focus is mastering the fundamentals of (M) and regime transitions: Use a single CSTR with variable speed agitation and a simple reaction, sweeping temperature while holding gas‑liquid ratio constant. Plot enhancement factor against (\sqrt{M}) to see the classic fast‑regime asymptote.
- If your primary focus is selecting the right commercial reactor type: Run the target chemistry in a stirred tank (high liquid hold‑up) and then in a packed column (high interfacial area), measuring conversion and selectivity. The configuration that yields the desired conversion with the smallest volume at the given gas‑liquid load identifies the controlling regime.
- If your primary focus is verifying a CSTR model for scale‑up: Decouple mass transfer from kinetics by measuring physical (k_L a) under identical hydrodynamics, then measure reactive rates. Compare the derived (M) from two independent methods—enhancement factor vs. estimated (D_L k_1 / k_L^2)—to confirm model consistency.
A thoughtfully designed pilot‑plant study transforms the abstract distinction between slow and fast regimes into a practical, repeatable design tool, ensuring your reactor decisions are built on measured reality rather than assumption.
Summary Table:
| Feature | Slow Reaction Regime | Fast Reaction Regime |
|---|---|---|
| Reaction Factor ($M$) | $M \ll 1$ | $M \gg 1$ |
| Reaction Location | Bulk liquid | Thin liquid film (interfacial zone) |
| Process Bottleneck | Chemical reaction rate | Mass-transfer rate |
| Reactor Design Focus | Liquid hold-up (Volume) | Interfacial contact (Area) |
| Enhancement Factor ($E$) | $E \approx 1$ (negligible) | $E \approx \sqrt{M} > 1$ (significant) |
Bring Complex Chemical Engineering Concepts to Life
Are you looking to bridge the gap between theoretical reaction kinetics and practical, hands-on learning?
LABPARK provides premium Educational and Vocational Unit Operations Pilot Plants in chemical engineering, bioprocess & biotech, and environmental & water treatment. Tailored for universities, research institutes, and enterprises, our advanced pilot plants empower students and researchers to safely manipulate, measure, and master gas-liquid CSTR dynamics in a controlled environment.
Ready to elevate your laboratory training capabilities? Contact us today to request a quote or custom consultation.
Related Products
- Dual-Drive Stirred Gas-Liquid Mass Transfer Coefficient Determination Pilot Plant
- Multi-Stage Stirred Tanks in Series Residence Time Distribution and Mixing Performance Determination Educational Pilot Plant
- Gas Phase Mixing and Residence Time Distribution Determination Educational Unit Operations Pilot Plant
- Residence Time Distribution and Reactor Flow Characteristics Determination Educational Pilot Plant
- Two Phase Flow Pattern Velocity Resistance Measurement Educational Pilot Plant
People Also Ask
- How does column packing affect absorption intensification, and how is it evaluated experimentally?
- Why Compare Membrane-Reservoir Models with Pilot Plant Data? Ensure Successful Process Scale-Up
- Why is pilot plant gas absorption lower than isothermal model predictions? Interfacial heating explained.
- Which interphase forces dominate gas dispersion in stirred reactors? Master Gas Holdup Models
- What operational factors must be considered in viscous gas-liquid mass transfer? Pilot Plant Guide