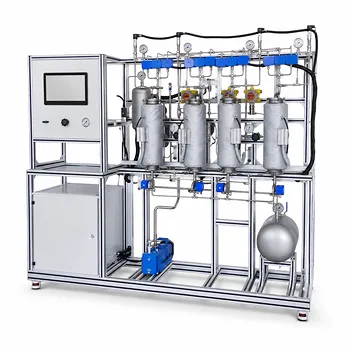
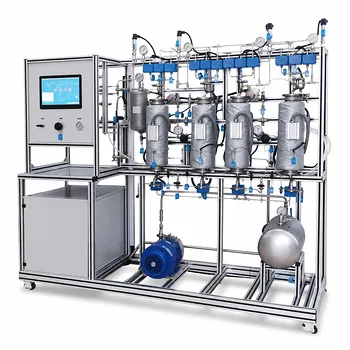
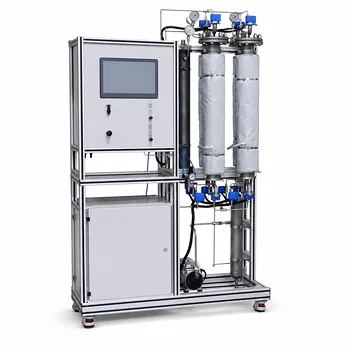
The definitive demonstration of gaseous pollutant removal in a pilot plant hinges on a controlled, measurable violation of equilibrium. It is not enough to simply observe a pollutant disappearing; rigorous engineering requires quantifying exactly how solubility drives that transfer. In a packed column or aeration tank, Henry's Law (which states gas solubility in a liquid is directly proportional to its partial pressure) is applied by manipulating the system's pressure, flow rates, and concentrations to force a target gas out of the gas phase and into a liquid solvent. You then prove the principle by monitoring concentration changes in real-time, verifying that the mass transfer correlates precisely with the partial pressure driving force predicted by the law, and calculating the resulting mass transfer coefficients essential for scale-up.
The core insight is that Henry's Law isn't just a static equation—it's the active operational lever in a pilot plant. The entire experiment is a physical demonstration of the concentration gradient acting as the engine for separation. However, this law is a precision tool, not a universal one; its application breaks down instantly if used outside strict boundaries of low pressure, dilute solutions, and non-dissociating solutes.
The Experimental Method: Driving Mass Transfer with Partial Pressure
The surface goal is removing a gas, but the deep engineering need is predicting and controlling that removal rate. A pilot plant turns Henry's Law into a dynamic experimental variable.
Creating the Concentration Gradient
For absorption to occur, the soluble pollutant must "want" to leave the gas and enter the liquid. This desire is a chemical potential difference, quantified by the difference between its current partial pressure and the equilibrium concentration defined by Henry's Law in the liquid.
In a pilot-scale packed column, you introduce a polluted gas stream at the bottom and a clean liquid solvent at the top. At the entry point, the gas has a high partial pressure of the pollutant. The fresh solvent, containing none of the pollutant, exerts essentially zero equilibrium back-pressure for that species. This creates the system's maximum possible driving force for mass transfer right at the liquid's inlet.
Monitoring the Solubility Curve in Real-Time
You demonstrate the principle by proving this driving force decays exponentially along the column's height. As the gas rises and the liquid falls, the pollutant dissolves. You use strategically placed gas sensors and liquid sampling ports to measure the pollutant's concentration in both phases at multiple stages.
The data you collect should show the gas-phase concentration dropping while the liquid-phase concentration rises. By plotting these values, you verify they are moving along the solubility line predicted by Henry's constant for that specific solute-solvent system at the operating temperature. The slope of this change is not arbitrary; it is the physical manifestation of the mass transfer coefficient.
Designing the Demonstration: Equipment and Protocol
To generate reliable data that truly reflects Henry's Law, the pilot plant's design must offer precise control over the variables defined in the equation.
The Critical Role of Counter-Current Contact
Pilot plants designed for absorption almost exclusively use counter-current flow. This configuration maximizes the log-mean concentration difference across the entire column, making the thermodynamic efficiency visible.
If you used co-current flow, the driving force would only be high at the very start and then rapidly dwindle. Counter-current flow keeps the "striving for equilibrium" state alive throughout the entire packed bed. An educational pilot plant using a safe system like carbon dioxide and water allows you to test this directly, changing the liquid-to-gas (L/G) ratio and observing the immediate effect on outlet CO2 concentration.
Calculating and Verifying the Constants
Your demonstration culminates in the quantitative analysis. You measure the inlet and outlet concentrations, gas and liquid flow rates, and the system's temperature and pressure. From this operational data, you can back-calculate the experimental Henry's Law constant.
This serves as the ultimate validation. If your calculated constant from a dynamic, flowing system matches the known thermodynamic constant for that gas-solvent pair, you have successfully demonstrated that the removal process is governed entirely by solubility principles. Any deviation tells you that other mechanisms, like liquid-phase chemical reactions, are accelerating the removal, which is a powerful empirical insight for designing industrial scrubbers using alkaline solutions.
Understanding the Limitations: Where Henry's Law Breaks Down
Demonstrating the boundaries of a principle is as powerful as demonstrating its success. This builds true, objective trust in the pilot plant as a testing tool.
The Constraint of Total System Pressure
Henry's Law is strictly a low-to-moderate-pressure model. The supplementary references explicitly state the constraint: total system pressure should generally not exceed 5 × 10^5 Pa.
In a pilot plant, you can demonstrate this failure. By systematically increasing the system's operating pressure beyond this threshold, you would observe that the simple linear relationship between partial pressure and liquid-phase mole fraction no longer holds. The gas molecules begin to interact with each other in the gas phase, and the assumption of an ideal, dilute solution fails. The data points will curve away from the predicted straight line, visually, and definitively, proving the theory's limit.
The Trap of Chemical Reaction and Dissociation
This is the most common pitfall in environmental demonstrations. Henry's Law applies only when the solute's molecular state remains identical in both the gas and liquid phases.
An experiment using hydrogen chloride (HCl) gas dissolving in water provides a classic counter-demonstration. On the surface, HCl is highly soluble. However, upon dissolving, it instantly dissociates into H+ and Cl- ions. The simple molecule in the gas phase no longer exists in the liquid. The linear Henry's Law relationship collapses because you are simultaneously measuring physical dissolution and a chemical reaction. For a valid solubility demonstration, you must use a non-dissociating gas like oxygen or carbon dioxide. For an advanced environmental demonstration, this discrepancy is the exact principle used to showcase how chemical scrubbing (absorption with chemical reaction) can drastically enhance removal capacity beyond physical solubility limits.
Making the Right Choice for Your Goal
Your applications are not theoretical. Whether you are teaching students or scaling up a process, your focus dictates which facet of this demonstration matters most.
- If your primary focus is teaching core fundamentals: Stick strictly to a CO2-water system in a packed column. Vary only one parameter at a time—like gas flow rate or water flow rate—to keep the linear relationship predicted by Henry's Law crystal clear and reproducible.
- If your primary focus is scaling up industrial scrubbing: Use the pilot plant to calculate mass transfer coefficients under different operating loads. Deliberately push the system toward the flooding point and study pressure drop curves, as these hydrodynamic limits will govern your full-scale equipment's capital and operating costs.
- If your primary focus is advanced environmental treatment: Compare a purely physical absorption run with a chemically enhanced one. Measure the removal efficiency of CO2 in pure water versus in a dilute alkaline solution to quantify how much additional capacity a chemical reaction provides beyond the ceiling set by Henry's Law alone.
The pilot plant is not just a model of an industrial process; it is a physical calculator that enables you to measure exactly how far you can push a thermodynamic principle before it breaks, giving you the confidence to design solutions that operate safely within those limits.
Summary Table:
| Demonstration Focus | Operational Approach | Key Engineering Insight |
|---|---|---|
| Core Fundamentals | CO2-Water system, variable gas/liquid flow rates | Verifies the linear solubility curve and driving force. |
| Industrial Scale-Up | Counter-current packed columns, variable L/G ratio | Calculates mass transfer coefficients and flooding limits. |
| Advanced Treatment | Physical vs. chemically enhanced absorption (alkaline) | Quantifies removal capacity limits beyond Henry's Law. |
| Boundary Testing | Operating pressures > 5 × 10^5 Pa, dissociating gases (HCl) | Identifies where ideal solution & solubility models break down. |
Bring hands-on thermodynamics and mass transfer to your lab with LABPARK. We provide premium Educational and Vocational Unit Operations Pilot Plants in chemical engineering, bioprocess & biotech, and environmental & water treatment tailored for universities, research institutes, and enterprises. Contact LABPARK today to discover how our customizable pilot systems can elevate your research and teaching capabilities!
Related Products
- Dual-Mode Gas Absorption and Desorption Unit Operations Training Pilot Plant
- Multi-Component Gas Pressure Swing Adsorption Pilot Plant for Unit Operations Education
- Carbon Dioxide Adsorption and Capture Educational Unit Operations Pilot Plant
- Packed Bed Absorption Educational Unit Operations Pilot Plant
- Absorption and Desorption Educational Unit Operations Pilot Plant
People Also Ask
- How do temperature and pressure affect gas absorption and desorption? Optimize Pilot Plant Performance
- How do two-film & penetration theories apply to gas absorption pilot plant teaching? Key pedagogical insights.
- How does partial pressure behavior influence gas absorption pilot plants? Master Mass Transfer
- How is the direction and driving force of mass transfer determined in a gas absorption unit operations pilot plant?
- What are the limitations of Henry's Law in gas absorption pilot plants? Avoid critical lab errors.