The liquid phase utilization factor ($\eta$) is the single most revealing metric for diagnosing reaction-diffusion bottlenecks in a pilot‑plant gas‑liquid reactor. It quantifies how much of the liquid volume truly participates in the reaction. When $\eta$ approaches 1, the reaction is kinetically controlled, and diffusion resistance is negligible. When $\eta$ is a small fraction, the reaction is fast, the active zone is confined to the interfacial film, and the bulk liquid is starved of reactant—meaning the process is squarely limited by mass transfer. This immediate diagnostic insight is what makes $\eta$ indispensable for pilot‑plant analysis, because it separates kinetic shortcomings from physical transport limitations and guides targeted optimization of packing, liquid hold‑up, and distribution.
In a pilot‑plant gas‑liquid reactor, the liquid phase utilization factor cuts through the complexity of coupled diffusion and reaction. A value near unity tells you to focus on chemistry; a low value screams that the mixing and interfacial area are your real bottlenecks. Knowing $\eta$ is the first step toward designing a reactor that actually uses the volume you paid for.
The Reaction–Diffusion Interplay in Gas‑Liquid Reactors
Why Gas–Liquid Systems Are Inherently Challenging
A gaseous reactant must first dissolve into the liquid and then diffuse through a stagnant boundary film before it can meet a dissolved liquid reactant.
The overall conversion rate is shaped by two competing players: the intrinsic chemical kinetics and the physical mass transfer steps.
In a pilot plant, you cannot simply assume one dominates—you must measure it.
Without a quantitative marker like $\eta$, you are left guessing whether a low conversion is due to a slow reaction or to poor gas–liquid contacting.
The Two Regimes: Kinetic Control vs. Mass Transfer Control
When the reaction is slow relative to diffusion, the dissolved gas has time to penetrate deep into the bulk liquid.
The liquid phase composition is nearly uniform, and the overall rate is set by the chemical kinetics.
When the reaction is fast, all the dissolved gas is consumed within the liquid film.
The bulk liquid never sees the gas reactant, and the process becomes limited by how quickly the gas can be transported across the interface and into the film.
The liquid phase utilization factor is the direct, quantitative gatekeeper that tells you which regime you are in.
Decoding the Liquid Phase Utilization Factor ($\eta$)
Definition and Physical Meaning
$\eta$ represents the fraction of the liquid phase volume that is effectively utilized for the reaction.
- If $\eta \approx 1$, the entire liquid volume is active; the concentration of dissolved gas throughout the bulk is close to the interfacial saturation level.
- If $\eta \ll 1$, only a thin layer of liquid adjacent to the gas interface is chemically productive. The bulk liquid is virtually a dead zone for that specific reaction.
This factor is not just an abstract number. It directly exposes how your reactor is using its physical volume.
How $\eta$ Exposes the Bottleneck
Measuring $\eta$ on a pilot‑scale column instantly tells you whether to intervene on the chemistry side or the transport side.
- $\eta$ near 1: Diffusion resistance in the liquid film is negligible. The bottleneck is kinetic—so you might change the catalyst, raise the temperature, or increase reactant concentration.
- $\eta$ very low: The reaction is mass‑transfer‑limited. The bulk liquid volume is underutilized, and you must improve gas–liquid contacting: increase interfacial area, enhance liquid mixing, or switch to a contactor type that offers higher mass transfer coefficients.
Pilot‑plant experiments can derive $\eta$ from measured conversions, liquid residence time, and known kinetic constants.
This transforms the plant from a black box into a transparent diagnostic tool.
Using $\eta$ in Pilot‑Plant Troubleshooting and Design
Diagnosing Underperformance
A common scenario: the pilot reactor yields half the expected conversion, yet the operating conditions seem reasonable.
If you calculate $\eta$ and find it is below 0.2, you immediately know that the bulk liquid is not participating.
The root cause might be poor liquid distribution, insufficient liquid hold‑up, or an inadequate packing choice—all variables you can change.
By tracking $\eta$ as you alter packing height or liquid flow rates, you can map exactly when the reactor transitions from mass‑transfer control to kinetic control.
This is essential for optimizing the packing height, liquid distribution design, and liquid holdup in gas–liquid columns.
Scaling Up with Confidence
Data on $\eta$ from a pilot plant become a powerful guide for scale‑up.
When $\eta$ remains low across a range of operating conditions, you know that a simple geometric enlargement will only scale up the underutilized volume.
You may need to consider a different contactor—for example, moving from a packed column to a stirred tank that can deliver higher gas–liquid interfacial area.
The enhancement factor (from the supplementary references) complements $\eta$ by quantifying how much the chemical acceleration amplifies absorption.
Together, they give you a full picture of mass transfer and reaction interaction, enabling accurate reactor sizing and contactor selection.
Understanding the Trade‑offs: Pitfalls and Limitations
Oversimplification of the Film Model
The classical $\eta$ concept often assumes a well‑defined stagnant film and pseudo‑first‑order reaction.
Real pilot‑plant hydrodynamics can involve surface renewal, bubbles, and complex flow patterns that deviate from this idealization.
Relying on $\eta$ alone without validating the underlying film model can lead to misinterpretation of the limiting step.
Interdependence with Other Parameters
$\eta$ is not an isolated figure; it depends on liquid hold‑up, interfacial area, diffusion coefficient, and reaction rate constant.
Changing one operating knob—say, liquid flow rate—improves conversion but might actually lower $\eta$ if the reaction remains fast enough to stay confined to the film.
A narrow focus on raising $\eta$ without understanding this coupling can misdirect your process development effort.
The Pseudo‑Steady‑State Assumption
Pilot‑plant runs often rely on a steady‑state or semi‑batch assumption for $\eta$ calculation.
If the liquid residence time is too short relative to the diffusion time, the film may not be fully established, and the measured $\eta$ can mask transient eddies.
Always cross‑check $\eta$ trends with direct mass transfer coefficient measurements or residence‑time distribution studies when the results seem contradictory.
Making the Right Choice for Your Project
Your path forward depends on what you are trying to achieve. Use $\eta$ as the compass, but adapt your action accordingly.
- If your primary focus is process optimization: Use $\eta$ to decide whether your next dollar should go into catalyst improvement or into enhancing gas–liquid contacting (e.g., better spargers, structured packing).
- If your primary focus is reactor scale‑up: Prioritize $\eta$ measurements across multiple scales. If the factor stays stubbornly low, reconsider the contactor type rather than blindly enlarging the vessel.
- If your primary focus is research diagnostics: Combine $\eta$ with the enhancement factor and liquid residence‑time data. This triangulation rigorously separates thermodynamic, kinetic, and mass transfer limitations in complex reaction networks.
- If your primary focus is training and education: Have students calculate $\eta$ from pilot‑plant conversion data and directly visualize how a fast reaction makes a large portion of the liquid volume useless. It anchors abstract mass transfer theory in a measurable, physical reality.
When you let the liquid phase utilization factor be your diagnostic lens, every pilot‑plant experiment becomes a controlled test that reveals whether your reactor’s performance is bound by chemistry or by physics—and exactly where to make the next improvement.
Summary Table:
| Liquid Phase Utilization Factor (eta) | Controlling Regime | Bottleneck Type | Recommended Optimization Action |
|---|---|---|---|
| eta ≈ 1 (High) | Kinetic Control | Chemistry / Reaction Rate | Increase temperature, change catalyst, or adjust reactant concentration. |
| eta ≪ 1 (Low) | Mass Transfer Control | Physical Transport / Mixing | Enhance gas-liquid contact, upgrade column packing, or improve sparging. |
Optimize Your Gas-Liquid Reactor Designs with LABPARK
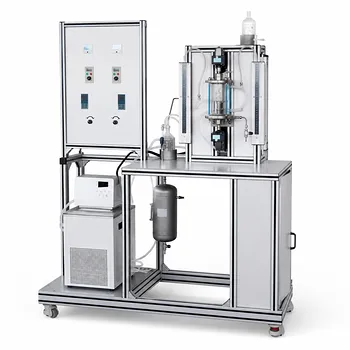
Are reaction-diffusion bottlenecks limiting your process efficiency or research accuracy? LABPARK provides state-of-the-art Educational and Vocational Unit Operations Pilot Plants in chemical engineering, bioprocess & biotech, and environmental & water treatment.
Designed specifically for universities, research institutes, and enterprises, our pilot plants allow you to accurately measure key chemical parameters like the liquid phase utilization factor (eta), turning complex mass transfer theory into actionable diagnostics.
Contact LABPARK today to discover how our high-quality pilot plants can elevate your research, training, and scale-up workflows!
Related Products
- Dual-Drive Stirred Gas-Liquid Mass Transfer Coefficient Determination Pilot Plant
- Micro-Scale Gas-Solid Catalytic Reaction Educational Pilot Plant
- Fixed Bed Gas Solid Catalytic Reaction Educational Pilot Plant
- Fluidized Bed Gas Solid Catalytic Reaction Educational Pilot Plant
- Fixed-Bed Chemical Reaction and Gas Dust Tar Removal Unit Operations Pilot Plant
People Also Ask
- How does temperature affect mass transfer rates in chemical engineering educational pilot plants?
- How do pilot plants study gas solubility in polymer melts at high pressures? Key Mass Transfer Insights
- How does column packing affect absorption intensification, and how is it evaluated experimentally?
- Why Compare Membrane-Reservoir Models with Pilot Plant Data? Ensure Successful Process Scale-Up
- How does k_La affect hydrogenation scale-up? Critical insights for pilot reactors.