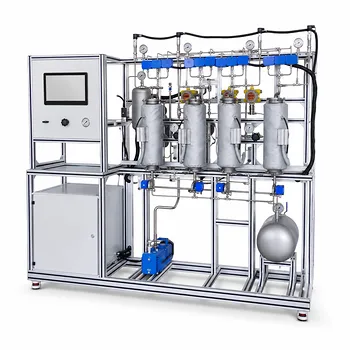
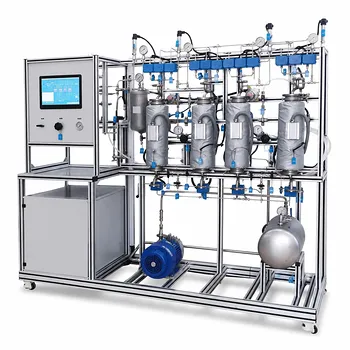
The difference between physical and chemical adsorption becomes starkly visible when you control temperature and watch how a pilot plant’s adsorption column responds. In a unit operations adsorption pilot plant, you demonstrate the distinction by running breakthrough experiments at different temperatures, measuring the low-level heat released during physical adsorption versus the intense exotherm of chemical bonding, and ultimately observing the stark contrast in how easily the adsorbent regenerates. By turning these operational signatures into hard numbers—enthalpies, activation energies, and regeneration efficiencies—students and researchers can map invisible molecular interactions onto clear, measurable engineering parameters.
An adsorption pilot plant isn’t just a scaled-down industrial bed; it’s a calorimeter and a kinetic analyzer in one. Physical adsorption reveals itself through modest, reversible capacity that drops with rising temperature. Chemical adsorption announces itself with high selectivity, strong exothermic spikes, and a stubborn refusal to desorb without drastic thermal or chemical force. The pilot plant’s sensors make these contrasting behaviors quantifiable, turning textbook theory into a compelling, data-driven narrative.
Designing a Definitive Demonstration Protocol
Every experiment in a pilot plant pivots on controlling a few critical variables. For adsorption, the master variable is temperature, because the two mechanisms obey fundamentally different energy landscapes.
Breakthrough Curves at Two Critical Temperatures
Run the same adsorbate-adsorbent pair at a low temperature (e.g., 25 °C) and a higher temperature (e.g., 80 °C) under otherwise identical flow, concentration, and pressure. For physical adsorption, the breakthrough time will always shorten at the higher temperature. The weak van der Waals forces allow the adsorbate to escape more easily as thermal energy increases, so the equilibrium capacity drops monotonically.
For chemical adsorption, you will initially see the opposite behavior. Because chemisorption requires an activation energy, raising the temperature increases the number of molecules that can overcome that barrier. The breakthrough time may actually lengthen at moderate temperature increases before eventually falling at still-higher temperatures. This non-monotonic temperature dependence is a classic fingerprint of activated chemisorption.
Following the Heat Wave Through the Bed
Place an array of fast-response thermocouples along the column axis. During physical adsorption, the temperature rise is barely perceptible—often less than 1–2 °C. The heat of adsorption is low (<40 kJ/mol), and the signal looks like a gentle thermal wave that travels with the mass transfer zone.
When chemical adsorption takes over, a sharp exotherm rips through the bed. You can watch a 10–30 °C temperature spike (or more, depending on the system) march downstream exactly where the chemical bonds are forming. This thermal signature, coupled with the high heat of adsorption (80–400 kJ/mol), is one of the most dramatic real-time proofs that a chemical reaction has occurred at the surface.
The Regeneration Test: Reversible Van der Waals vs. Irreversible Bonds
After saturating the bed, initiate a regeneration cycle. For a physical adsorbate on activated carbon, simply raising the bed temperature by 50–100 °C (temperature swing) or dropping the system pressure (pressure swing) will restore the adsorbent to nearly its original capacity. Run multiple cycles—the breakthrough time remains consistent.
For chemisorbed species, a mild temperature swing is largely ineffective. You will need to heat the bed to 200 °C or more, or use a chemical displacing agent, to partially recover capacity. Even then, the adsorbent often retains some “irreversible” loading, demonstrated by a permanently shortened breakthrough time in subsequent cycles. This single demonstration teaches more about adsorption reversibility than any textbook diagram.
Translating Plant Data into Thermodynamic Truths
The beauty of a modern pilot plant is its ability to generate equilibrium and kinetic data that directly yield the fundamental parameters of adsorption.
Calculating Isosteric Heat: The Numerical Acid Test
Collect equilibrium loading data at multiple temperatures (isotherms) and apply the Clausius–Clapeyron-like isosteric method. If the calculated isosteric heat falls below 40 kJ/mol, you have physical adsorption. The value reflects only the weak condensation-like forces. A value consistently above 80 kJ/mol is the hallmark of chemical bond formation. This calculation, performed with students’ own pilot plant data, makes abstract bond energies concrete.
Activation Energy from Dynamic Breakthrough
By fitting the breakthrough curve shape at different temperatures, you can extract a rate constant and then an Arrhenius activation energy. Physical adsorption shows an apparent activation energy near zero (limited only by pore diffusion). The process is inherently fast and non-activated. Chemisorption systems yield a positive, often substantial activation energy (20–100 kJ/mol). This stark numerical difference is a quantitative demonstration that can be directly compared with tables of chemical bond strengths.
Understanding the Trade-offs and Practical Pitfalls
Demonstrating chemical adsorption cleanly demands careful system selection and equipment awareness. Not all adsorbate-adsorbent couples are equally illuminating.
System Selection: For physical adsorption, a simple pair like nitrogen on activated carbon or zeolite 13X at near-ambient conditions is ideal. For chemisorption, you might use carbon dioxide on amine-functionalized sorbents, oxygen chemisorption on a reduced metal catalyst, or hydrogen sulfide on zinc oxide. These systems show unambiguously high heats and sluggish desorption, but they also carry safety and disposal considerations.
Equipment Constraints: The pilot plant must be designed for the thermal loads you plan to generate. Chemisorption exotherms can cause local hot spots that, if unmanaged, damage the adsorbent or introduce non-isothermal artifacts. Precise temperature control and high-integrity insulation are non-negotiable. Additionally, irreversibility means that a chemisorption demonstration may consume a batch of adsorbent, or require long regeneration times, making it less suited for rapid-fire student lab rotations.
Data Interpretation Ambiguities: Some systems can exhibit both physisorption and weak chemisorption, leading to intermediate isosteric heats (40–80 kJ/mol) that challenge a clean binary classification. Students must learn to look at the full constellation of evidence—temperature dependence, regeneration behavior, and kinetic parameters—rather than relying on a single metric.
Making the Right Choice for Your Educational or Research Goal
Your specific learning objective dictates which pilot plant experiment will deliver the most profound insight.
- If your primary focus is teaching fundamental thermodynamic differences: Design a set of equilibrium isotherm runs at three to four temperatures and let students calculate isosteric heat. The clear numerical threshold between physisorption and chemisorption makes the theory unforgettable.
- If your primary focus is demonstrating industrial separation cycles: Run repetitive temperature swing or pressure swing cycles on a physical adsorption system to showcase perfect regenerability. Contrast this with a single chemisorption cycle where capacity is partly lost after regeneration—instantly conveying why irreversible adsorbents work best as guard beds rather than cyclic separators.
- If your primary focus is exploring reaction kinetics and activated processes: Conduct breakthrough experiments across a wide temperature range for a chemisorption system and have students derive the Arrhenius parameters. Include a physical adsorption system as a baseline to highlight the complete absence of activation energy.
By systematically commanding temperature, reading the column’s thermal language, and demanding proof of reversibility, you turn an adsorption pilot plant into the ultimate arbiter of surface chemistry—a tool that doesn’t just tell students what physisorption and chemisorption are, but shows them exactly how to measure and prove it.
Summary Table:
| Operational Parameter | Physical Adsorption (Physisorption) | Chemical Adsorption (Chemisorption) |
|---|---|---|
| Temperature Effect | Breakthrough time shortens as temperature rises | Breakthrough time may lengthen initially due to activation energy |
| Thermal Signature | Mild temperature rise (< 1–2 °C; < 40 kJ/mol) | Sharp temperature spike (10–30 °C+; 80–400 kJ/mol) |
| Regeneration | Easy and reversible via mild temperature/pressure swing | Hard to regenerate; requires high heat (> 200 °C) or chemicals |
| Activation Energy | Near zero (diffusion-limited) | Positive and substantial (20–100 kJ/mol) |
Bring hands-on thermodynamic and kinetic learning to your facility with LABPARK. We design and manufacture high-precision Educational and Vocational Unit Operations Pilot Plants in chemical engineering, bioprocess & biotech, and environmental & water treatment for universities, research institutes, and enterprises. Empower your students and researchers to map molecular interactions to real-world engineering data—contact us today to discuss your laboratory requirements!
Related Products
- Multi-Component Gas Pressure Swing Adsorption Pilot Plant for Unit Operations Education
- Pressure Swing Adsorption Educational Unit Operations Pilot Plant
- Educational Pressure Swing Adsorption Ethylene Capture Unit Operations Pilot Plant
- Carbon Dioxide Adsorption and Capture Educational Unit Operations Pilot Plant
- Carbon Dioxide Capture and Utilization Educational Pilot Plant for Unit Operations
People Also Ask
- How does Pressure Swing Adsorption (PSA) technology operate? Optimize gas separation with pilot plants.
- How is the direction and driving force of mass transfer determined in a gas absorption unit operations pilot plant?
- How do two-film & penetration theories apply to gas absorption pilot plant teaching? Key pedagogical insights.
- How does partial pressure behavior influence gas absorption pilot plants? Master Mass Transfer
- What are the limitations of Henry's Law in gas absorption pilot plants? Avoid critical lab errors.