The central lesson a carbon capture pilot plant can teach is this: concentration isn't just a number—it's the single most powerful lever driving capture difficulty and cost. By deliberately switching between a high-CO₂ feed that mimics purification tail gas and a low-CO₂ feed that replicates boiler flue gas, you transform abstract theory into a set of vivid, measurable contrasts in separation efficiency, energy use, and process economics.
Educational pilot plants let you run side-by-side “experiments” on two very different industrial realities. A stream with more than 70% CO₂ (tail gas) behaves almost like a concentrated product; a stream with only 10–20% CO₂ (flue gas) demands far more energy, solvent, and process sophistication to achieve comparable capture. Observing that gap firsthand cements why dilute sources dominate real-world costs and technology choices.
Why Source Concentration Dictates Everything
The Thermodynamic Driving Force
Capture processes—whether absorption, adsorption, or membranes—all depend on a partial pressure difference. A purification tail gas carrying >70% CO₂ at even moderate total pressure creates a massive CO₂ partial pressure. That high gradient pushes carbon dioxide rapidly into a solvent or across a membrane.
A boiler flue gas, in contrast, holds only 10–20% CO₂ and sits near atmospheric pressure. The resulting driving force is an order of magnitude smaller. Mass transfer slows, equilibrium solubility drops, and the energy needed to reverse the capture step balloons. A pilot plant makes this force visible: the same absorption column that reaches near-total removal from tail gas may struggle to hit 90% capture from flue gas without doubling solvent flow or reboiler duty.
The Cascade into Economics
Low concentration doesn’t just make capture harder—it makes it several times more expensive per tonne of CO₂. The supplementary energy for solvent regeneration, the larger equipment volumes, and the higher solvent circulation rates all scale non-linearly. When students log steam consumption and CO₂ captured side by side, they see why industry prioritizes high-concentration streams like ammonia purge gas or natural gas processing tail gas before tackling power plant flue gas.
Building the Demonstration: How to Configure the Pilot Plant
Simulating Both Gas Streams Accurately
Modern pilot plants include gas blending panels with mass flow controllers. You can blend pure CO₂ with nitrogen (to mimic dry flue gas) or with air to replicate tail gas compositions. The membrane pilot plant described in the supplementary references, for example, is built around a CO₂/N₂ blending system—perfect for generating a 15% CO₂ “flue gas” mix and an 80% CO₂ “tail gas” mix. The same blending philosophy applies to absorption or adsorption skids.
Running the Absorption Comparison
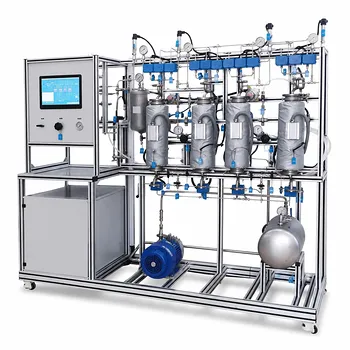
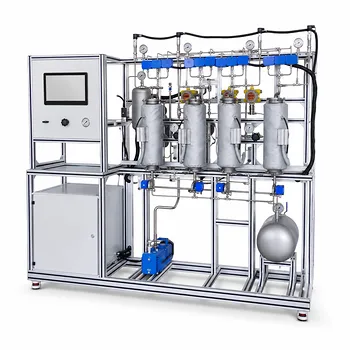
The gas absorption unit operations pilot plant is the most direct tool. Configure it with a standard amine solvent (e.g., MEA) and fixed column internals. Then:
- Feed the high-CO₂ stream (tail gas case). Record the rich solvent loading, the temperature bulge along the column, and the reboiler steam rate needed for regeneration.
- Switch to the low-CO₂ stream (flue gas case). Keep all other parameters constant. Students will immediately see that lean loading barely changes, rich loading drops, and the solvent must be heated far more per unit of CO₂ desorbed—exactly the metric that determines regeneration energy.
By comparing inlet/outlet gas concentrations, temperature profiles, and solvent conversion, learners tie the chemical enhancement factor to the actual partial pressure regime. The exothermic reaction heat remains similar per mole of CO₂ captured, but many more moles of gas must be processed to snag each mole of CO₂, which is why the net energy per avoided tonne rises sharply.
Observing Membrane Behavior with Different Feeds
Switch the demonstration to a membrane separation pilot plant. Feed the same two mixtures at identical pressure and temperature. For the high-CO₂ tail gas surrogate, the permeate side will be rich in CO₂ with high flux. For the low-CO₂ flue gas feed, flux drops and reaching a higher permeate purity demands either a higher pressure ratio or a multi-stage arrangement. Students analyze retentate and permeate compositions to calculate stage cut, recovery, and purity—revealing why membrane systems excel at upgrading already-concentrated streams but struggle with dilute feeds without huge energy input for compression.
The Numbers That Bring the Lesson to Life
What to Measure and Plot
Guide students to extract these specific comparisons across the two feeds:
- Mass transfer coefficient (KGa). It often shifts from gas-film to liquid-film control as CO₂ concentration falls, changing how column internals perform.
- Solvent loading differential. Rich minus lean loading will be far larger for the high-concentration feed, demonstrating equilibrium limits.
- Specific reboiler duty (MJ per tonne CO₂). This metric can easily double or triple for the flue gas case, mirroring real-world data.
- Membrane recovery vs. purity. Plot a trade-off curve for each feed to show that the dilute feed’s curve sits far closer to the undesirable corner of low purity and low recovery.
A Simple Side-by-Side Table
Even a lab-report table that contrasts a 75% CO₂ feed with a 15% CO₂ feed under identical absorber conditions can become the single most referenced data set in the course. It crystallizes why the same unit operation that seems “easy” with tail gas becomes economically marginal with flue gas.
Understanding the Trade-offs and Limitations
Technology Suitability Shifts Drastically
High-concentration streams often pair well with physical solvents (e.g., propylene carbonate) or simple membranes because the natural driving force is already strong. Applying the same physical solvent to a dilute flue gas gives unacceptable capture rates. The pilot plant proves that chemically reactive solvents like MEA are essential for low partial pressures—and that they come with higher regeneration energy and corrosion risks. This is the exact logic that determines real industrial process selection.
Impurities Change the Game
Real boiler flue gas contains SOx, NOx, oxygen, and particulates. Most educational pilot plants use clean synthetic blends, which lets students isolate concentration effects beautifully. But it’s vital to point out that impurities would further increase solvent degradation, reclaiming costs, and operational complexity—widening the gap between tail gas and flue gas even more. Acknowledge this simplification, and you build trust in the transferability of the lesson.
Safety and Scale Considerations
A stream with >70% CO₂ may be treated safely inside a well-ventilated pilot plant, but it still demands careful monitoring of leaks and pressure accumulation. Similarly, amine systems operating at high rich loadings can become corrosive if water balance isn’t maintained. These practical details reinforce that “easier to capture” does not mean “no engineering needed.”
How to Apply This to Your Curriculum or Research Goal
If your primary focus is teaching process economics: Structure the lab so students calculate levelized cost of capture using their own energy and solvent data. The side-by-side tail gas vs. flue gas runs provide a self-contained case that makes the cost drivers obvious.
If your primary focus is unit operations fundamentals: Run both absorption and membrane modules with the identical two feeds. Let students argue which technology is “best” for each scenario and why the answer flips when concentration changes.
If your primary focus is environmental impact: Combine the pilot plant data with life-cycle inventory numbers. Show that even when a solvent captures CO₂ efficiently from flue gas, the overhead energy may shift the net carbon balance—a problem far less acute with high-purity tail gas.
A single pilot plant, deliberately toggled between two synthetic feed compositions, transforms carbon capture from a textbook abstraction into a tangible, memorable demonstration of why concentration is the linchpin of feasible, affordable decarbonization.
Summary Table:
| Parameter | Purification Tail Gas | Boiler Flue Gas |
|---|---|---|
| CO₂ Concentration | High (>70%) | Low (10–20%) |
| Driving Force | High partial pressure | Low partial pressure |
| Regeneration Energy | Low per tonne of CO₂ | High per tonne of CO₂ |
| Preferred Technology | Physical solvents / Membranes | Chemical solvents (e.g., MEA) |
Elevate Chemical Engineering Education with LABPARK
Bring hands-on carbon capture concepts to life. LABPARK provides premium Educational and Vocational Unit Operations Pilot Plants in chemical engineering, bioprocess & biotech, and environmental & water treatment. Designed to meet the rigorous training needs of universities, research institutes, and enterprises, our scalable systems allow students to master real-world separation and decarbonization processes.
Contact us today to discuss your laboratory configuration and receive a customized solution!
Related Products
- Carbon Dioxide Capture and Utilization Educational Pilot Plant for Unit Operations
- Bench Scale Carbon Dioxide Capture Educational Unit Operations Pilot Plant
- Carbon Dioxide Adsorption and Capture Educational Unit Operations Pilot Plant
- Carbon Dioxide Absorption and Desorption Educational Pilot Plant for Carbon Capture Studies
- Low Concentration Carbon Dioxide Capture Pressure Swing Adsorption Educational Pilot Plant
People Also Ask
- What are the differences between post- and pre-combustion carbon capture training pilot plants?
- What unit operations are critical for CCUS training pilot plants? Build hands-on engineering expertise.
- How do temperature variations affect CO2 transport models in pilot plants? Model vs Reality
- How does operating pressure influence the transition between absorption and desorption in a CO2 pilot plant?
- How to demonstrate physical vs chemical absorption using a pilot plant? A practical lab guide.