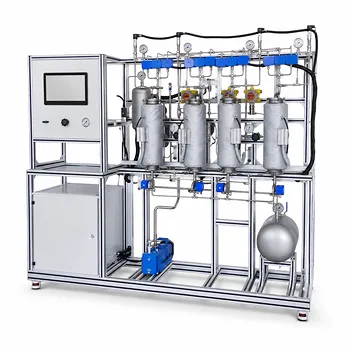
To calculate compressor power and outlet temperature in an educational pilot plant, instructors and students apply the principles of polytropic compression. Two paths are common. If a Mollier diagram for the working fluid is available, the specific work is estimated directly from the enthalpy change between inlet and outlet. Without a diagram, the polytropic efficiency, compressibility factor, and heat capacity ratio are used to compute the shaft work analytically, then converted to electrical power using the motor efficiency. The discharge temperature is found from the familiar relation T₂ = T₁ × (P₂/P₁)^m, where the exponent m encapsulates both the gas properties and the irreversibilities of the real process.
The polytropic model is the practical bridge between ideal isentropic theory and the friction-heated reality inside a pilot‑plant compressor. By measuring inlet conditions and applying manufacturer efficiency data or a Mollier chart, students can predict the mechanical power demand and the hot discharge temperature with good accuracy—so long as the gas stays well away from its critical point. Near critical conditions, all simplified equations become unreliable, and process simulation software must complement the physical plant.
The Thermodynamic Foundation of Gas Compression
Why the Polytropic Path Is the Educational Standard
Real compression is neither perfectly adiabatic nor isothermal. The polytropic process (PVⁿ = constant) captures the continuous heat exchange and fluid friction that occur. In an educational setting, the polytropic index n and the polytropic efficiency Eₚ give students a single, consistent framework to relate the actual work to the reversible work while directly explaining the extra temperature rise caused by inefficiency.
The Two Primary Calculation Pathways
Mollier Diagram Route
If an enthalpy‑entropy‑pressure‑temperature chart exists for the gas, students plot the suction condition, follow the constant entropy line to the discharge pressure to get the isentropic endpoint, then correct with the polytropic efficiency to find the real discharge enthalpy. The work per unit mass is simply the enthalpy difference h₂,actual – h₁.
Analytical Route
When no Mollier diagram is available, the polytropic head and shaft work are calculated using average values for the compressibility factor Z and the specific heat ratio γ (often denoted k). The polytropic efficiency then gives the real work and the exponent for the temperature rise. This is the method most students learn first because it connects directly to the gas laws and visible pressure measurements.
Step‑by‑Step Calculation of Compressor Power
Determining the Fluid Work (Shaft Work)
The polytropic head—the work per unit mass for an ideal, reversible polytropic compression—is expressed as:
[ h_{poly} = \frac{Z R_s T_1}{\frac{n-1}{n}} \left[ \left(\frac{P_2}{P_1}\right)^{\frac{n-1}{n}} - 1 \right] ]
For an ideal gas, the exponent is tied to the polytropic efficiency and the isentropic exponent through the relationship (\frac{n-1}{n} = \frac{k-1}{k \cdot E_p}). The actual shaft work per unit mass is then (w_{shaft} = h_{poly} / E_p). Multiplying by the mass flow rate (\dot{m}) gives the shaft power: (P_{shaft} = w_{shaft} \cdot \dot{m}).
Converting Work to Electrical Power Input
The compressor in a pilot plant is driven by an electric motor, so the electrical power drawn from the grid is larger than the shaft power. The estimation uses:
[ P_{elec} = \frac{-W \cdot \dot{m}}{E_c} ]
where (-W) is the fluid work per unit mass (a positive number) and (E_c) is the motor efficiency. In small educational units, motor efficiency typically ranges from 80 % for a 5 kW motor to over 90 % for larger industrial drives. Students can measure true power consumption from the motor drive and compare it with their predictions to validate both the thermodynamic model and the motor efficiency tables.
Pilot Plant Verification and Instrumentation
Educational units are instrumented with pressure transmitters, thermocouples, and flow meters. By reading suction temperature T₁, suction pressure P₁, discharge pressure P₂, and mass flow, students can either:
- Predict the electrical input and outlet temperature using a known polytropic efficiency from the manufacturer, then check against the actual readings.
- Back‑calculate the polytropic efficiency from measured shaft power or electrical power, thereby quantifying how close the real machine performs to the theoretical model.
This hands‑on feedback loop cements the concepts far better than textbook problems alone.
Predicting the Outlet Temperature Accurately
The Temperature Rise Exponent m
After compression, the discharge temperature is given by:
[ T_2 = T_1 \left( \frac{P_2}{P_1} \right)^m ]
where (m = \frac{n-1}{n}). Substituting the isentropic and efficiency relation yields (m = \frac{k-1}{k \cdot E_p}). Because Eₚ is always less than 1, the real exponent is larger than the isentropic exponent—meaning the real gas heats up more than an ideal, lossless compression would suggest.
The Direct Link Between Inefficiency and Heat‑Up
Every deviation from reversibility converts a fraction of the input work into extra thermal energy that stays with the gas. The polytropic efficiency Eₚ tells you exactly how large that fraction is. Students can observe this quantitatively: comparing the measured T₂ with the isentropic prediction reveals the energy penalty directly on the temperature gauge, making the concept of efficiency tangible.
When Simplified Equations Break Down
The simple T₂ relation and the constant‑Z, constant‑γ assumptions hold well for many diatomic gases at pressures far from the critical point. Once the operating state creeps near the critical region, Z changes dramatically and the analytical formulas lose accuracy. In those cases, the pilot plant work must be paired with process simulation software (for example, Aspen HYSYS or equivalent) that uses a real‑gas equation of state. The educational message is clear: simplified equations teach the physics, but industrial rigor demands a simulator when the gas behaves non‑ideally.
Understanding the Trade‑offs
Hand Calculation Simplicity Versus Analytical Precision
The polytropic method with averaged properties is deliberately simple. It requires only a pocket calculator and is excellent for building intuition. The trade‑off is that it relies on a single Z value and a constant γ, which can introduce errors of several percent for multi‑stage compression or for gases with significant heat capacity variation.
Inaccuracy Near the Critical Point
As the primary reference highlights, near critical conditions the simplified T₂ equation becomes unreliable. In an educational pilot plant, if the working fluid is, say, a light hydrocarbon near its critical pressure, the measured and calculated temperatures can diverge sharply. Instructors use this discrepancy to teach students why process simulation software becomes indispensable in real industrial design.
The Balance Between Theory and Software in the Curriculum
Teaching hand calculations and simulator use side by side is essential. The hand method grounds students in the underlying thermodynamic principles and lets them question the simulator’s output. The simulator then shows how real‑gas behavior, multi‑stage cooling, and variable Z change the numbers. The combination produces a graduate who trusts neither tool blindly but knows when to rely on each.
How to Apply This to Your Educational Goals
Tailor your instructional approach to what matters most in your pilot‑plant exercise.
- If your primary focus is teaching thermodynamic fundamentals: Keep the calculation strictly manual. Use a constant γ, estimate Z from generalized charts, and have students hand‑calculate the polytropic work and outlet temperature. Then compare with a Mollier diagram, if one exists for the gas, to make the enthalpy‑based reasoning concrete.
- If your primary focus is accurate plant design or research data: Always cross‑check the simplified equations with a process simulator using a suitable equation of state. When the gas operates near its critical point, let the simulator drive the prediction and use the pilot plant to validate, not the other way around.
- If your primary focus is cost estimation and economic analysis: Extend the power calculation to fluid power (kW) to estimate the purchased cost of the compressor. Apply the appropriate bare module factor based on compressor type (centrifugal, reciprocating, diaphragm) and material to teach students how pressure rating and material choice multiply the installed cost.
A well‑run pilot plant exercise turns the abstract equations of polytropic compression into a vivid, measurable experience—and that’s where deep understanding takes root.
Summary Table:
| Calculation Route | Key Inputs Required | Advantages | Limitations |
|---|---|---|---|
| Mollier Diagram Route | Enthalpy ($h$), entropy ($s$), pressures ($P_1, P_2$) | Highly visual; captures real gas behaviors directly | Requires specific chart for the working fluid |
| Analytical Route | Compressibility ($Z$), heat capacity ratio ($\gamma$), efficiency ($E_p$) | Easy formula calculation; no charts needed | Inaccurate near the critical point; assumes constant $Z$ and $\gamma$ |
Elevate Chemical Engineering Education with LABPARK
Bridge the gap between thermodynamic theory and practical application. LABPARK designs and manufactures premium Educational and Vocational Unit Operations Pilot Plants in chemical engineering, bioprocess & biotech, and environmental & water treatment.
We help universities, research institutes, and enterprises enhance their training programs with:
- Real-World Validation: Let students test polytropic models and verify compressor power calculations on real physical systems.
- Advanced Instrumentation: High-precision sensors to capture pressure, temperature, and flow data seamlessly.
- Tailored Configurations: Custom-built plants to fit your specific curriculum and space requirements.
Ready to transform your laboratory training? Contact LABPARK today to explore our pilot plant solutions!
Related Products
- Multi-Component Gas Pressure Swing Adsorption Pilot Plant for Unit Operations Education
- Educational Compression Refrigeration Performance Determination Unit Operations Pilot Plant
- Carbon Dioxide Adsorption and Capture Educational Unit Operations Pilot Plant
- Bench Scale Carbon Dioxide Capture Educational Unit Operations Pilot Plant
- Dual-Mode Gas Absorption and Desorption Unit Operations Training Pilot Plant
People Also Ask
- How does Pressure Swing Adsorption (PSA) technology operate? Optimize gas separation with pilot plants.
- How is the direction and driving force of mass transfer determined in a gas absorption unit operations pilot plant?
- How do two-film & penetration theories apply to gas absorption pilot plant teaching? Key pedagogical insights.
- How does partial pressure behavior influence gas absorption pilot plants? Master Mass Transfer
- What are the limitations of Henry's Law in gas absorption pilot plants? Avoid critical lab errors.