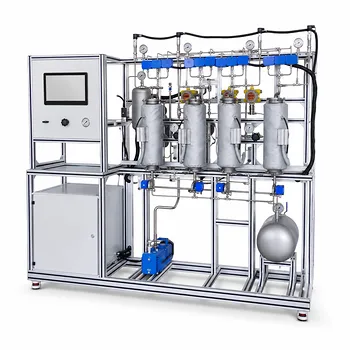
The choice between the Kremser analytical method and the graphical McCabe-Thiele technique hinges on one critical property: the linearity of the equilibrium relationship. In educational gas absorption pilot plants, the Kremser method is preferred when the system is dilute—meaning the solute concentration is low and the equilibrium line can be accurately represented by a straight line (Y* = mX + b) with a constant slope m. This analytical approach delivers a precise, mathematical calculation of theoretical stages, avoids the subjective drawing errors of manual step-diagrams, and is exceptionally well-suited for multi-component absorption studies.
For dilute gas absorption with a linear equilibrium line, the Kremser method aligns perfectly with educational goals: it provides an objective, error-free calculation of theoretical stages, enabling students to rigorously compare experimental data with theory and reliably determine column efficiency—tasks the subjective graphical method struggles to match.
Why Linearity Makes the Kremser Method Preferable
The Assumption of Dilute Mixtures
Dilute gas mixtures exhibit near-linear equilibrium behavior over the operating range. When the solute makes up only a small fraction of the total gas, the heat of absorption is minimal and the equilibrium curve flattens into a straight line. This condition is common in educational pilot plants using benign systems like ammonia-water or carbon dioxide-water at low concentrations.
Constant Slope and the Absorption Factor
A constant equilibrium slope m turns the separation into a straightforward algebraic problem. The absorption factor A = L/(mG) becomes a reliable parameter, directly linking liquid and gas flow rates to stage requirements. The Kremser equation mathematically ties the unabsorbed fraction ϕ_A to A and the number of theoretical stages N:
[ N = \frac{\ln\left[\left(1 - \frac{1}{A}\right)/\phi_A + \frac{1}{A}\right]}{\ln(A)} ]
This equation works because it assumes linearity throughout. Without that assumption, the formula collapses, making the graphical method necessary.
Precision and Objectivity in the Educational Lab
Eliminating the Human Drawing Error
In a graphical method, a student draws the operating line and equilibrium curve on graph paper, then manually “steps” between them to count stages. Slight pencil misalignments, inconsistent plotting, or misinterpretation of curve intersections can shift the answer by half a stage or more. The Kremser method replaces this subjective process with a clean, mathematical result derived from directly measured inlet and outlet concentrations.
Direct Calculation from Measured Data
During pilot plant runs, students measure gas-phase compositions at the column inlet and outlet to determine ϕ_A. With known L/G and m, they compute A and then N in seconds—no graphical construction required. This immediate, reproducible number then serves as a benchmark for calculating overall plate efficiency by comparing it to the known number of actual stages in the column. Such a tight experimental‑theoretical chain reinforces understanding of mass transfer fundamentals.
Multi-Component Absorption: Where Graphical Methods Fail
The Complexity of Overlapping Steps
When more than one solute is absorbed, creating a separate McCabe-Thiele diagram for each component becomes unwieldy. The Kremser method handles multi‑component absorption elegantly: each component has its own equilibrium constant m_i and thus its own absorption factor A_i, leading to a distinct N for each solute from the same formula. In an educational setting, this teaches students to analyze selective absorption and the influence of relative volatility on stage requirements, all without drowning in overlapping lines on a single graph.
Understanding the Trade-offs
When the Equilibrium Curve Curves
The Kremser method fails if the equilibrium relationship deviates significantly from linearity—for example, in concentrated systems where m changes noticeably across the column. Any attempt to force a constant m onto a curved equilibrium will produce incorrect stage numbers that mislead efficiency calculations. In such cases, the graphical method, though slower, becomes the only physically sound approach.
The Trap of Misjudging Linearity
Students can be tempted to apply the Kremser equation to systems that appear dilute but actually have a subtle curvature. Even minor non‑linearity can distort the absorption factor and compound error with each theoretical stage. A responsible educational protocol first verifies linearity—either by inspecting equilibrium data or by performing a quick graphical sanity check—before committing to the analytical method.
Putting It into Practice in the Pilot Plant
The right choice depends on your educational objective:
- If your primary focus is precise performance comparison: Use the Kremser method for a direct, error‑free calculation that lets you accurately assess column efficiency and validate your experimental data against theory.
- If your primary focus is teaching core separation principles: Introduce the graphical stepping method first to visualize the operating and equilibrium lines, then reinforce the concept by showing how the Kremser equation reaches the same result mathematically for linear systems.
- If your primary focus is multi‑component absorption: Always default to the Kremser method; it turns a nearly impossible graphical task into a simple, informative exercise that highlights component‑specific behavior.
A clear understanding of when the equilibrium line is truly straight transforms the Kremser equation from a black‑box formula into a powerful, time‑saving tool that elevates both the accuracy and the pedagogy of your gas absorption experiments.
Summary Table:
| Feature / Condition | Kremser Analytical Method | Graphical Method (McCabe-Thiele) |
|---|---|---|
| Equilibrium Line | Strictly Linear (Dilute systems) | Curved (Concentrated systems) |
| Calculation Style | Mathematical / Formula-based | Manual plotting and stepping |
| Human Error | None (Objective & highly precise) | Moderate (Subjective drawing errors) |
| Multi-Component | Easy (Handles multiple solutes) | Extremely complex / Unwieldy |
| Primary Use Case | Efficiency analysis & verification | Visualizing separation principles |
Elevate Your Chemical Engineering Lab with LABPARK
Looking to enhance your students' hands-on learning and research accuracy? LABPARK provides premium Educational and Vocational Unit Operations Pilot Plants in chemical engineering, bioprocess & biotech, and environmental & water treatment. Designed specifically for universities, research institutes, and enterprises, our pilot plants allow students to seamlessly apply both the Kremser method and graphical techniques in real-world scenarios.
Ready to upgrade your laboratory capabilities? Contact LABPARK today to find the perfect pilot plant solution for your institution!
Related Products
- Carbon Dioxide Absorption and Desorption Educational Pilot Plant for Carbon Capture Studies
- Carbon Dioxide Adsorption and Capture Educational Unit Operations Pilot Plant
- Bench Scale Dual Column Gas Separation and Capture Educational Pilot Plant
- Multi-Component Gas Pressure Swing Adsorption Pilot Plant for Unit Operations Education
- Absorption and Desorption Educational Unit Operations Pilot Plant
People Also Ask
- How does operating pressure influence the transition between absorption and desorption in a CO2 pilot plant?
- How do temperature variations affect CO2 transport models in pilot plants? Model vs Reality
- What unit operations are critical for CCUS training pilot plants? Build hands-on engineering expertise.
- How do electrolytes affect phase equilibrium in absorption pilot plants, and how to calculate it?
- Why is critical surface tension key in column internals? Optimize gas absorption pilot plant efficiency