The Nightmare in the Sparger
It’s 2 a.m. in the pilot plant. Your 200-liter bioreactor run looks beautiful. Cell density is peaking, viability is high. But the off-gas analyzer is telling a different story, one your dissolved CO₂ (dCO₂) probe is only starting to echo. The carbonate equilibrium is shifting, and you have no idea how this chemistry will behave when multiplied by fifty. You’ve been here before—the gut-punch uncertainty that transforms a successful pilot into a failed manufacturing batch.
The culprit is invisible, odorless, and brutally mathematical. Dissolved carbon dioxide.
The problem isn’t just that CO₂ is produced. It’s that its management directly impacts critical quality attributes and process stability. Get it wrong at scale, and you’re not just losing a batch; you’re losing months of development, millions in raw materials, and the quiet confidence your team needs to take the next biologic to market.
First-principles modeling of dCO₂ mass transfer doesn’t just solve this problem. It changes how you sleep at night.
The Creature in the Carbonate System
Most engineers treat dCO₂ like an exhaust fume—something to be diluted away. But it’s far more cunning. It weaves together three separate processes, any one of which can ruin your day.
The Triple Threat: Respiration, pH, and Buffering
CO₂ enters the liquid from cellular respiration—every living cell exhales it. Simultaneously, your pH control system might be adding bicarbonate or CO₂ gas to hold your setpoint. And underneath it all, the carbonate equilibrium (CO₂ ↔ HCO₃⁻ ↔ CO₃²⁻) is buffering the culture, shifting with every hundredth of a pH unit.
You can’t just measure pCO₂ and call it done. Total dissolved carbon is a moving target. An empirical correlation—those trusty rules of thumb—cannot see this complexity. A first-principles model writes the equilibrium reactions and the mass balances, force-linking cell metabolism, titration, and stripping into a single, transparent system.
Why This Matters for the Biologic You’re Building
Excessive dCO₂ doesn’t just slow growth. It alters protein glycosylation patterns—the specific sugar decorations that determine a therapeutic protein’s efficacy and immunogenicity. Over-strip CO₂ by sparging too aggressively, and you’ll spike the pH, trigger a compensatory acid addition, and send osmolality soaring. The cells stress. The glycoform profile drifts. Your product quality slips away, silently.
The model captures that tightrope. It lets you see the dCO₂ range where both cell health and critical quality attributes coexist.
Building a Digital Twin for dCO₂
You don’t need a supercomputer. You need a disciplined set of mass transfer equations, calibrated by the one thing no simulation can invent: high-quality pilot plant data.
Step 1: Tie Metabolism to CO₂ Evolution
The model anchors itself to your offline measurements. Viable Cell Density (VCD) and lactate concentration feed the respiration calculation, giving you a real-time CO₂ Evolution Rate (CER). This isn’t magic; it’s stoichiometry. Every mole of glucose consumed or lactate produced tells a CO₂ story, and the model listens.
Step 2: Respect the Liquid Chemistry
You write the dissociation constants for carbonic acid. You account for the base addition that traps CO₂ as bicarbonate. Suddenly, your total inorganic carbon isn’t a mystery—it’s a predicted state variable. The model can separate what the cells produced from what the pH system injected, something no single probe can ever do.
Step 3: The k_L a Bridge
This is where geometry meets physics. The volumetric mass transfer coefficient (kLa) for CO₂ determines how fast your sparged gas can strip dissolved CO₂ away. You don’t need a unique measurement for every gas. The model uses the ratio of diffusivities (CO₂ vs. oxygen) to translate your known oxygen kLa into a CO₂ kLa. Suddenly, sparger design, agitation rate, and gas flow are mathematically linked to dCO₂ control.
Step 4: Validate with the Pilot Plant
Here, your pilot scale becomes the linchpin. You feed the model historical runs—small-scale and pilot-scale data sets where dCO₂ probes, off-gas analyzers, and mass flow controllers were working in concert. You tune only physically meaningful parameters. When the model faithfully reproduces the dCO₂ trajectories you already trust, it’s not a calibrated black box. It’s a validated digital twin, ready to extrapolate to 2,000 liters or beyond.
Without the high-frequency, multi-instrument data that a pilot plant provides, you’re training on shadows. With it, you’re training on reality.
How the Model Changes Your Scale-Up Conversations
With a validated model in hand, your organization’s risk calculations shift. The pilot plant is no longer a miniature factory; it’s a mathematical proving ground.
Predict full-scale dCO₂ profiles without a single engineering run
You plug in the large-scale vessel geometry, the planned sparge rates, and the hydrostatic head pressure at the bottom of the tank. The model outputs the expected dCO₂ range for your peak VCD. One afternoon of simulation replaces a six-figure scale-up test that could have failed catastrophically. The safe operating window is no longer a guess—it’s a distribution.
Size mass flow controllers and spargers on demand, not on over-design
The model quantifies exactly how much CO₂ mass must leave the liquid. You can size your gas supply system and mass flow controllers to meet a mathematically derived requirement, not a budgeted safety factor. Similarly, you can select sparger pore size and impeller configuration to achieve the required kLa without inducing excessive foam or damaging shear. Equipment sizing becomes a calculated decision, freeing capital and engineering time.
Design control loops that anticipate, not just react
Because the model understands the dynamic response of dCO₂ to changes in sparge rate and agitation, it can serve as the process model for advanced control. You can design automated cascades that tie the dCO₂ measurement to your gas flow controller. As the culture ramps up its metabolic rate, the stripping capacity follows smoothly, holding the dCO₂ in its design space without constant operator intervention. Consistency becomes programmable.
The Hidden Physics That Kills Empirical Rules
Scale-up traps hide everywhere. Two of the most common “keep it simple” rules will sabotage your dCO₂ control faster than any contamination.
Constant VVM: The Impeller Flooding Trap
Keeping the gas volume per liquid volume per minute (VVM) constant seems logical. But in a larger tank, the superficial gas velocity surges. Bubbles rise so fast they overwhelm the impeller, the flow regime collapses, and the kLa you desperately need for CO₂ stripping plummets. Your model would have warned you, if only you’d stopped relying on VVM.
Constant Superficial Velocity: The Starvation Trap
Fix the superficial gas velocity, and the VVM drops abruptly—often to 30% or less of the pilot scale. The total gas flow becomes insufficient. Cells starve for oxygen, and CO₂ accumulates unchecked, even though the impeller is mixing well. Again, the model sees the accumulation coming, but only if you give it the correct gas flow inputs.
The Balanced Path: Model-Derived k_L a Scaling
The model points you to the most robust strategy: scale to maintain a constant volumetric mass transfer coefficient (kLa) for CO₂. This yields a moderate increase in superficial velocity and a controlled drop in VVM, avoiding both flooding and starvation. You’re not just choosing a number; you’re preserving the essential physics that governed your successful pilot runs.
Choosing Your Strategy, Guided by the Model

Your validated dCO₂ model isn’t just a forecasting tool. It’s a decision architecture. Which door you walk through depends on your most pressing fear—and your model illuminates the path.
- When your deepest fear is a failed scale-up run: Simulate the dCO₂ profile under a constant-kLa scale-up criterion. This provides the safest, most balanced path between oxygen supply and CO₂ removal, without demanding a full-scale validation batch. The model lets you sleep.
- When your obsession is a specific glycosylation profile: Set a precise dCO₂ upper limit as your critical quality attribute threshold. Simulate backwards to determine the maximum allowable VCD and the minimum sparge rate. Then build your upstream process to fit that constraint. The model becomes your quality-by-design engine.
- When your urgency is speed to technology transfer: Embed the validated model into a digital twin that the pilot plant team can explore virtually. Test raw material variability, feeding strategy shifts, and harvest timing. Define the robust design space that remains valid at the intended manufacturing scale without months of physical experiments. The model compresses time.
From Academic Theory to Physical Confidence

None of this works on a whiteboard alone. First-principles models require heavy lifting in the real world—the kind of lifting that only a well-designed pilot plant can provide. Universities, research institutes, and bioprocess enterprises need unit operations pilot plants that are instrumented to deliver the high-integrity data a model must ingest.
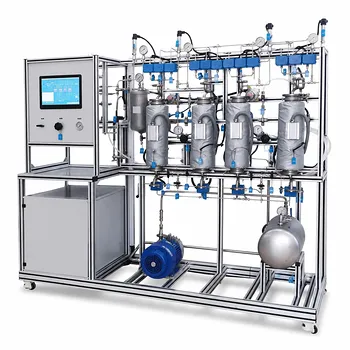
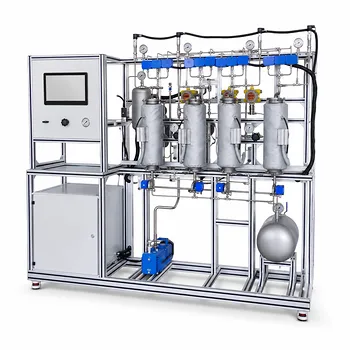
This is where LABPARK enters the equation. Every dCO₂ mass transfer model is only as credible as the bioreactor system that validated it. LABPARK provides precisely the Educational and Vocational Unit Operations Pilot Plants that turn theoretical equations into manufacturing confidence. Their chemical engineering, bioprocess, and biotech platforms give your team the data density—off-gas analysis, mass flow control, dCO₂ probes, and scalable vessel geometries—necessary to calibrate first-principles models and transfer processes seamlessly to production scale.
A validated model, born in a LABPARK pilot plant, doesn’t just predict the future. It builds the bridge that gets you there without fear.
Related Products
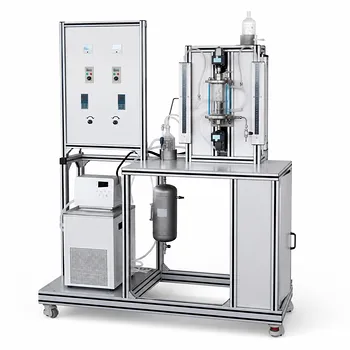
- Dual-Drive Stirred Gas-Liquid Mass Transfer Coefficient Determination Pilot Plant
- Carbon Dioxide Absorption and Desorption Educational Pilot Plant for Carbon Capture Studies
- Liquid-Liquid Mass Transfer Coefficient Determination Educational Pilot Plant
- Dual-Mode Rectification Pilot Plant for Practical Training Unit Operations
- Carbon Dioxide PVT Curve Determination Educational Unit Operations Pilot Plant