The Data That Doesn’t Arrive on a Screen
There’s a moment in every bioprocess engineer’s education when they realize the job isn’t about knowing what should happen. It’s about knowing what is happening, right now, in the steel and glass in front of them.
A computer monitor tells a clean story. Numbers update. Curves trend smoothly toward a target. But seasoned operators develop a second sense—a nagging feeling that the smooth curve is lying.
The most valuable skill in bioprocessing isn’t computational fluency or mastery of regulatory frameworks. It’s the ability to run a physical, side-by-side comparison and decide, with conviction, that the reaction is complete or that the fraction is pure enough to pool.
That skill has a remarkably humble teacher: a glass plate coated with silica gel.
Why Thin-Layer Chromatography Teaches What Simulators Can’t
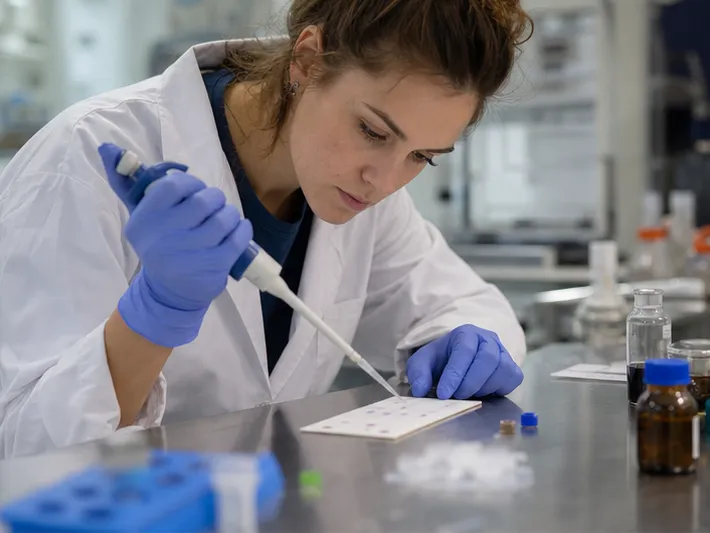
Thin-layer chromatography (TLC) gives you an immediate, visual side-by-side comparison of starting materials and products on a single plate. There’s no data processing layer. No software interpretation. Just your eyes on a plate, making a binary call.
In a bioprocess unit operations lab, you use TLC to track a reaction by spotting your raw material next to timed samples of the reaction mixture. As the product spot appears and the raw material spot fades, you’re watching the transformation. When the raw material spot completely vanishes, the reaction is done.
For purity checks, you spot fractions from a purification step. If only one spot appears, you’ve reached your target. Multiple spots tell you more separation is needed.
The entire exercise takes minutes. It costs pennies. And it builds the psychological infrastructure for every complex decision an engineer will make at pilot and production scale.
The Side-by-Side Logic You Carry for a Career
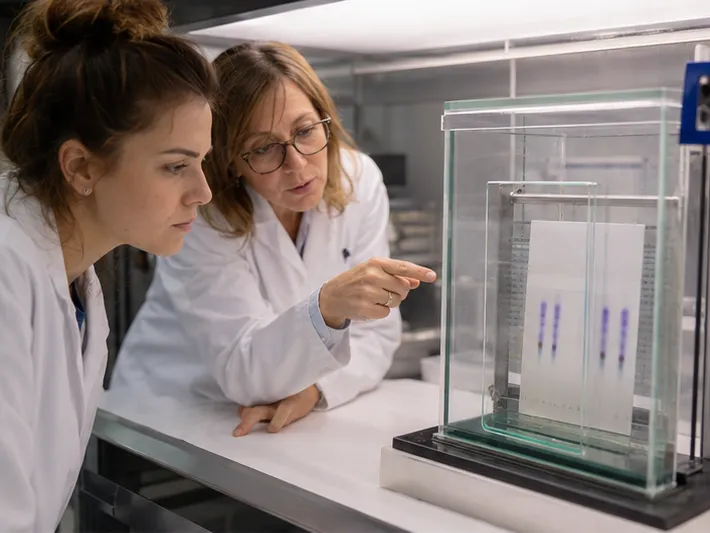
On a single TLC plate, three lanes run parallel: lane 1 is pure raw material, lane 2 is a co-spot (raw material mixed with reaction mixture), and lane 3 is the reaction sample from a specific time point.
This layout eliminates the need to trust memory. You don’t recall what the starting material looked like on last Tuesday’s plate. You compare it directly, on the same stationary phase, developed in the same solvent chamber, under the same conditions.
The co-spot is a quiet genius. It proves both compounds can coexist on the plate without interacting strangely. If you see only one spot in the co-spot lane, something went wrong—perhaps the product and starting material share the same Rf under these conditions, or the reaction never initiated.
This is the building block of process intuition: never ask “what changed?” when you can directly observe the change.
Reading the Chromatogram: The Story in the Spots
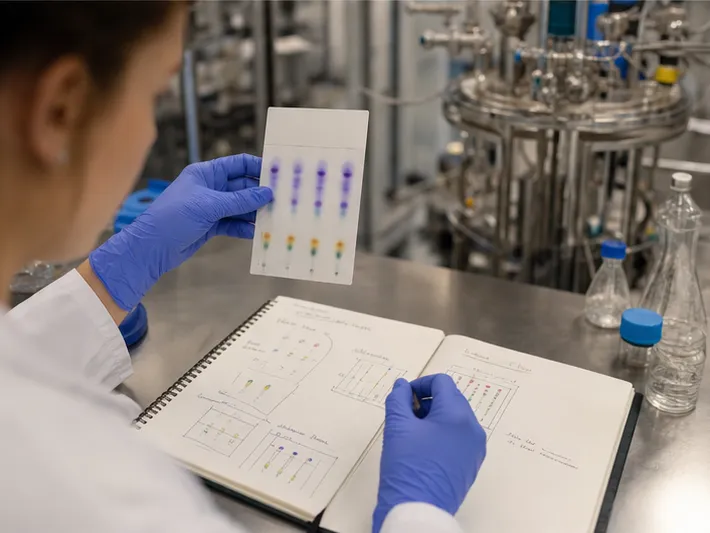
Visualize the development. The starting material sits at a certain height. The product, if formed, will appear at a different retention factor (Rf).
You interpret progress by watching two simultaneous changes:
- The darkening of the product spot
- The lightening of the raw material spot
In early samples, the raw material dominates. At intermediate stages, both spots compete for your attention. The endpoint is unambiguous: the raw material spot completely disappears. Only the product remains.
That visual disappearance is more memorable than any numerical conversion percentage. It’s a qualitative endpoint that sticks in the mind of a future pilot plant operator who will one day decide whether to harvest a $200,000 batch.
What a Single Spot Doesn’t Tell You—and Why That’s the Point
When a fraction from a purification column yields a single, well-defined TLC spot at the expected Rf, a student’s instinct is to declare victory. And they should—tentatively.
A single spot under a specific detection method is a claim of homogeneity, but a limited one. It means that under these TLC conditions—this solvent, this stationary phase, this visualization—no other compound was detected.
The reality is heavier:
- If your impurity doesn’t absorb UV, it’s invisible under a UV lamp.
- If your impurity doesn’t react with the stain, it’s invisible after staining.
- If your impurity has the same Rf as your product, it’s invisible at every step.
The absence of a spot is not the absence of a compound.
This is the critical mindset. A student who learns this in a unit operations lab carries healthy skepticism into their career. They learn to follow TLC with an orthogonal check—melting point, refractive index, or a second TLC run with a different solvent system.
They learn that purity is never proven. It’s only supported by the evidence you’ve gathered so far.
The Visualization Trade-offs: A Lesson in Epistemology
Not all compounds reveal themselves under white light. A UV lamp at 254 nm or 365 nm catches UV-active species. Chemical staining—iodine vapor, ninhydrin, phosphomolybdic acid—develops different classes of molecules.
A good lab habit: circle spots with a pencil under UV before staining, then note whether the stain reveals additional spots that UV missed.
This double-check isn’t just a technique. It’s a philosophy: every detection method has a bias. The complete picture comes from layering imperfect views.
| Detection Method | What It Reveals | What It Misses |
|---|---|---|
| UV (254 nm) | Aromatic, conjugated systems | Aliphatic impurities |
| UV (365 nm) | Extended conjugation | Non-fluorescent species |
| Iodine stain | Many organic compounds | Low-affinity species |
| Ninhydrin | Amines, amino acids | Non-nitrogenous impurities |
A student who runs two visualization methods and finds an extra spot has learned something no data historian can teach: your analytical window defines your observable reality.
The Speed That Enables Real-Time Decision Making
Every reaction in a bioprocess lab has a rhythm. TLC helps you hear it.
The technique’s power isn’t its resolution—HPLC beats it handily. It’s not its quantitation—densitometry is a patch, and a mass spectrometer is the real answer. The power is speed.
You can sample a reactor, spot a plate, develop it in a few minutes, and have actionable qualitative data before the next sample interval. That turnaround time means you can:
- Decide to stop a reaction at the right endpoint, not after the endpoint has passed
- Adjust a column chromatography cut mid-separation, not after pooling the wrong fractions
- Troubleshoot a stalled reaction in the same lab period, not after the data comes back from the analytical core
The Intuition You Build in the Gaps
Between spotting the plate and visualizing it, a student waits. It’s only a few minutes, but in that gap, they think about what they’ll see.
Will the raw material spot still be there? Is the product forming? Did the reaction stall?
These small hypotheses—tested every 15 or 30 minutes—are the raw material of process intuition. The student begins to sense the kinetics not as a differential equation, but as a visual rhythm. They know the spot will fade. They’re learning to predict when.
When TLC Fails: The Lessons That Stick Longest
No analytical tool works perfectly every time. TLC’s failures are its own curriculum.
Poor Resolution
If the solvent system doesn’t separate raw material from product, the student sees a single smeared spot and learns nothing. The fix—running a quick pre-lab screen of solvent mixtures (hexane/ethyl acetate gradients are a classic starting point)—teaches method development.
Irreproducible Rf Values
A student runs the same sample twice and gets different Rf values. The plate wasn’t activated. Or the developing chamber wasn’t saturated with solvent vapor. Or the lab humidity shifted.
Each of these failure modes forces attention to the details that computerized systems hide: sample preparation, environmental control, the physical chemistry of the stationary phase.
Invisible Impurities
The most humbling moment: a student pools what appears to be pure product based on a single TLC spot, then runs an orthogonal check—and finds it’s 85% pure at best.
The impurity was there. It just didn’t show up under the chosen visualization method. That lesson—your purity is only as good as your detection method’s ability to see what you don’t want—is worth a semester of lectures.
The Lab That Teaches This: Why Pilot Plant Scale Matters
These skills don’t develop in a vacuum. They require a physical space where students can:
- Draw samples from a real process stream
- Spot a plate, develop it, and interpret results in the same lab session
- Make a decision—pool, discard, continue, stop—that has consequences for the next unit operation
- Correlate TLC results with other unit operations: drying, formulation, further purification
That’s the logic of a unit operations pilot plant. Not a benchtop demonstration, but a scaled-down version of an industrial process where the same analytical workflow—sample, analyze, decide—operates at a frequency that builds genuine proficiency.
The LABPARK Approach: Engineering Education at Process Scale
LABPARK Educational and Vocational Unit Operations Pilot Plants are designed precisely for this purpose. In chemical engineering, bioprocess and biotech, and environmental and water treatment, these systems bridge the gap between classroom theory and industrial reality.
The pedagogical insight is straightforward: you can’t teach process decision-making without a process to decide about. A TLC plate in isolation is a chemistry demonstration. A TLC plate drawn from a bioreactor that a student is actively operating—that’s an engineering education.
When a student runs a column, collects fractions, spots a plate, and makes the call to pool fractions 12 through 18, they’re not memorizing a procedure. They’re practicing the role they’ll occupy in industry: the person who decides.
The pilot plant environment also forces integration. TLC isn’t a standalone exercise. It’s in service of:
- Monitoring a reaction to define the endpoint before the next unit operation begins
- Assessing fraction purity to determine which streams to combine and which to discard
- Troubleshooting when the product distribution doesn’t match expectations
| Application | Key Method | Indicator of Success | Integration Point |
|---|---|---|---|
| Reaction Monitoring | Side-by-side spotting (starting material, co-spot, timed sample) | Complete disappearance of raw material spot | Triggers next unit operation (separation, quenching) |
| Purity Assessment | Fraction analysis against reference standard | Single, sharp spot at expected Rf | Informs pooling strategy for downstream processing |
| Process Troubleshooting | Deliberate variation of solvent, plate, or visualization | Changed separation pattern that explains discrepancy | Builds method development skills for pilot-scale problem-solving |
The Tacit Knowledge That Separates Operators from Engineers
There’s a quiet difference between a trained operator and a thinking process engineer.
The operator follows the batch record: sample at hour 4, submit to analytical, wait for results. If the HPLC shows 98% conversion, they proceed. If it doesn’t, they escalate.
The engineer knows before the data arrives. They’ve been pulling small samples, running quick TLC plates at the line, watching the spots shift. They have a qualitative model of the reaction’s progress that’s faster than any analytical queue.
When the HPLC data finally comes back and confirms what the engineer already knew, that’s not redundancy. That’s the convergence of fast, qualitative, hands-on data with slow, quantitative, instrumental data. The TLC built the intuition. The HPLC provided the proof.
The Psychological Foundation: Comfort with Ambiguity
The most important thing TLC teaches isn’t chemistry. It’s comfort with ambiguous, incomplete information.
A TLC plate never says “conversion is 94.7%.” It says “the starting material spot is mostly gone, and the product spot is strong, but there’s a faint spot at a third Rf that we can’t identify.”
A student learns to act on that incomplete picture. They learn to say:
- “The reaction is essentially complete—time to stop.”
- “There’s an impurity—we need to resolve it in the next step.”
- “I don’t know what that third spot is, but I know it’s there.”
These are the judgments that process engineers make daily. No monitor makes them for you.
Building the Complete Engineer: Hands, Eyes, and Judgment
A bioprocess curriculum that produces only chromatographers misses the point. One that produces only bioreactor operators misses the point too.
The goal is the integrated engineer: someone who can run a fermenter, sample it, analyze the sample with TLC, interpret the results in the context of the overall process flow, and make a timely decision that affects downstream unit operations.
That integration only happens when the analytical technique is embedded in a real process flow. It happens at pilot plant scale, where the time between sampling and the next unit operation is short enough that analytical results actually change behavior.
LABPARK pilot plants are built for this exact learning loop. Students don’t analyze mock samples from a teaching assistant’s reagent bottle. They sample from a live process that they’re operating. The TLC results matter because the next decision matters.
The Memory That Outlasts the Semester
Years after graduation, a bioprocess engineer won’t remember the specific Rf value of their sophomore lab product. But they’ll remember:
- The feeling of circling a spot under UV light with a dull pencil
- The tension of waiting for a stain to develop, not knowing if an impurity would appear
- The confidence of pooling fractions based on their own data and being right
Those sensory memories—the tactile, visual, olfactory experience of analytical chemistry at the pilot scale—are the foundation of process intuition. They’re what allow an experienced engineer to walk onto a production floor, look at a process, and say “something’s not right” before any alarm sounds.
That’s not magic. It’s pattern recognition, built painstakingly, plate by plate.
The Skill Simulators Forget
Process simulators are extraordinary tools. They model thermodynamics, predict separations, optimize schedules. But they have one blind spot: they can’t teach you to doubt them.
A simulator will draw a beautiful chromatography profile from column specifications and feed composition. It won’t show you the impurity that co-elutes because your actual stationary phase aged differently than the model assumed.
Only a physical technique—fast, cheap, and directly comparative—teaches that skepticism. TLC provides a snapshot of reality that a student holds in their own hands. That snapshot either matches the simulation or it doesn’t. When it doesn’t, the student learns to trust the plate, question the model, and investigate the discrepancy.
That habit—verifying computational predictions with physical measurement, quickly and routinely—defines the safe, effective process engineer.
The Closing Argument
Bioprocess education stands at an inflection point. Simulation software grows more powerful every year. Online analytical instruments promise real-time, automated purity monitoring. The temptation is to declare hands-on techniques like TLC obsolete, to replace the physical plate with a virtual chromatogram.
But the plate teaches something the screen cannot: the personal ownership of a measurement. When a student spots a plate, develops it, and interprets it, no algorithm stands between their eyes and the data. The conclusion is theirs alone. So is the responsibility.
That’s the education that produces engineers who can handle the ambiguity of real bioprocesses—the reactions that don’t follow the textbook, the purifications that leave a puzzling third spot, the moments when the only question that matters is “do I stop now or keep going?”
The best pilot plants are designed to ask that question, repeatedly, until the answer becomes instinct. LABPARK’s unit operations systems provide the physical platform for that education—the bioreactors, columns, and separation trains that turn analytical technique into engineering judgment.
Because the bioprocess industry doesn’t need more operators who can read a screen. It needs more engineers who know what’s happening in their process before the screen confirms it.
Related Products
- Educational Rotary Disc Liquid-Liquid Extraction Pilot Plant
- Constant Pressure Filtration Educational Unit Operations Pilot Plant
- Liquid-Liquid Mass Transfer Coefficient Determination Educational Pilot Plant
- Hot Filtration Educational Unit Operations Pilot Plant Laboratory System
- Continuous Batch Extractive Distillation Educational Pilot Plant



















