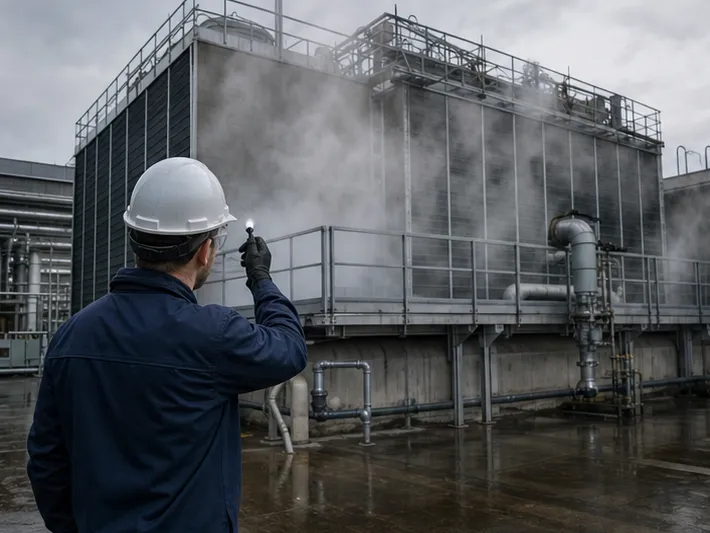
A Scene from the Pilot-Plant Floor
The graduate student stared at the psychrometer, then back at her spreadsheet. The wet-bulb thermometer read 28 °C. The packed column hummed with a benzene‑air mixture, and the energy balance she had been taught to trust demanded an adiabatic saturation temperature of 32 °C. The mismatch wasn’t a sensor fault; it was a thermodynamic identity crisis playing out in real time.
She had collided with a fact that many experienced operators discover only when a campaign fails to close: the wet‑bulb temperature and the adiabatic saturation temperature are not the same thing. In water‑air systems they look identical—a numerical coincidence so perfect that textbooks fuse them into a single line on the psychrometric chart. Switch the fluid, and the illusion evaporates.
What follows is the story of that convergence, why it lasts only as long as you stay inside water’s charmed circle, and how a properly instrumented pilot plant turns this nuance from a trap into a teaching tool.
The Two Numbers Every Operator Measures (But Rarely Defines)
Before you can trust either reading, you have to accept that they come from different worlds. One is a raw physical measurement; the other lives on the far side of an equation.
Wet‑Bulb Temperature: A Dynamic Steady State
Wrap a wick around a thermometer, wet it, and blow air past it. As the liquid evaporates, it steals latent heat from the bulb. The thermometer cools until the rate of sensible‑heat delivery from the warmer air exactly balances the cooling flux of evaporation.
That reading is the wet‑bulb temperature ((t_w)). It is not an equilibrium property of the gas‑vapor mixture. It is a steady‑state condition dictated by the rates of heat and mass transfer—how fast the air can carry energy and how quickly the vapor can diffuse away.
Adiabatic Saturation Temperature: A Thermodynamic Limit
Now imagine a perfectly insulated chamber. Liquid recirculates through it until the leaving gas becomes fully saturated. No heat enters or exits; the gas cools solely because it gave up sensible heat to evaporate liquid. The temperature at which that saturated gas exits is the adiabatic saturation temperature ((t_{as})).
You compute (t_{as}) from an enthalpy balance. You do not measure it with a sock‑covered bulb. It is a thermodynamic endpoint, a fixed destination for a given inlet condition.
Pressures to deliver results can make us conflate the two because the numbers feel interchangeable. That psychological shortcut is safe only for one family of fluids.
The Convergence Point: When Heat and Mass Transfer Shake Hands
The reason (t_w) and (t_{as}) collapse onto a single value for air‑water is not divine providence. It is a very specific equality hiding inside the dimensionless groups that govern transport.
The Lewis Factor and the Critical Ratio
The simultaneous transport equations yield a ratio that governs how the two temperatures relate:
[ \frac{h}{k_Y , c_s} \quad \text{— the ratio of the convective heat‑transfer coefficient to the mass‑transfer coefficient divided by the humid heat.} ]
Through the Chilton‑Colburn analogy, this equals roughly (Le^{2/3}). The wet‑bulb temperature equation contains this ratio explicitly, while the adiabatic saturation equation replaces it with unity. When (h/(k_Y c_s) \approx 1), the two equations become functionally identical, and (t_w \approx t_{as}).
Why Water Gets Lucky: (h/k_Y \approx c_s)
In an air‑water mixture, the coefficient ratio (h/k_Y) hovers around 1.09 kJ/(kg·K). The humid heat of moist air sits between 1.05 and 1.10 kJ/(kg·K). The Lewis factor is essentially 1.0.
Nature baked a transport coincidence into the system. The dynamic wet‑bulb reading and the thermodynamic limit land on the same number, which is why a single psychrometric chart line can serve both purposes. For a cooling tower or a water‑based humidification pilot plant, treating them as identical is not just convenient—it is numerically accurate.
The Divergence: What Happens When You Leave Water Behind
Replace water with benzene, toluene, or almost any organic solvent, and the numerical serenity vanishes. The heat‑ and mass‑transfer coefficients rearrange themselves. The ratio (h/k_Y) drifts far from the vapor‑gas mixture’s humid heat.
A Benzene–Air Pilot-Plant Example
For a benzene‑air system, (h/k_Y) can climb to 1.8 kJ/(kg·K) while the benzene‑air humid heat drops considerably lower. The Lewis factor no longer equals unity.
If an operator measures a wet‑bulb temperature of 28 °C in that benzene column and plugs it straight into an adiabatic‑saturation‑based energy balance, the calculated outlet humidity will be wrong. The evaporative load won’t close. The mass‑transfer coefficients extracted from that run will carry a systematic bias. When the data moves to scale‑up, the error propagates into oversized exchangers or undersized contactors—expensive mistakes that began with a perfectly calibrated thermometer.
The Psychological Trap: Trusting the Sensor Over the Theory
We are wired to believe what we can hold. The wet‑bulb thermometer is tangible; the adiabatic saturation temperature is an abstraction. In the pressure of a pilot‑plant campaign, it feels safer to trust the number you can read. But in non‑aqueous systems, that instinct leads you to treat a rate‑limited steady state as if it were a thermodynamic truth. The result is a data set that looks precise but is systematically skewed.
Common Pitfalls That Corrupt Heat‑and‑Mass‑Transfer Data
| Pitfall | What Happens | When It Bites |
|---|---|---|
| Substituting (t_w) for (t_{as}) in a solvent column | Humidity and energy balance close with a hidden offset | Any organic‑solvent distillation or stripping pilot |
| Teaching the equivalence without the Lewis‑factor caveat | Students build intuition that fails outside water‑air | Bioprocess and chemical engineering programs using varied solvents |
| Using standard psychrometric charts for non‑aqueous vapors | Enthalpy and humidity extracted from the chart are physically wrong | Solvent‑recovery and specialty‑chemical operations |
| Ignoring the transport ratio in a gas‑liquid contactor | Scale‑up rules derived from (t_w)-based mass‑transfer coefficients are unreliable | Any pilot plant that feeds a full‑scale design |
Each of these errors starts with a subtle assumption: that the fluid doesn’t matter because the chart you learned on was universal. It isn’t.
Making the Right Choice for Your Unit‑Operations Platform
The corrective action depends on what flows through your column and what question you are trying to answer.
- Water‑based cooling towers or humidifiers: Treat (t_w) and (t_{as}) as numerically equal. Use the standard psychrometric chart with confidence.
- Non‑aqueous solvents in a research or teaching pilot plant: Never rely on a wet‑bulb reading alone. Either measure (t_{as}) directly with a recirculating saturator apparatus, or compute it using the gas‑specific Lewis factor obtained from independent heat‑ and mass‑transfer experiments.
- When verifying energy balances: Explicitly measure (h/(k_Y c_s)) for your system. A quick set of bench‑scale experiments can reveal whether the water‑air shortcut is safe, turning a potential systematic error into a dimensionless‑number validation exercise.
From Theory to Proficiency: Why the Right Pilot Plant Changes the Game

Understanding these two temperatures intellectually is not the same as feeling the divergence in real time. That is precisely where a modern educational and vocational unit‑operations pilot plant earns its place. A platform that allows you to switch from water to an organic solvent, to instrument both the wet‑bulb wick and a recirculating saturation loop, and to watch the two values peel apart on a live dashboard transforms a textbook footnote into a visceral lesson.
LABPARK designs precisely this kind of system. Their Educational and Vocational Unit Operations Pilot Plants—deployed in chemical engineering, bioprocess, biotech, and environmental & water treatment programs—give universities, research institutes, and enterprises the flexibility to investigate complex gas‑liquid heat‑and‑mass‑transfer phenomena with industrial‑grade precision. Instead of hoping the water‑air analogy holds, researchers and students can:
- Configure a recirculating saturator to capture the true adiabatic saturation temperature.
- Compare (t_w) and (t_{as}) in real time across different solvents.
- Extract Lewis factors that close energy balances and build defensible scale‑up models.
- Develop the instinct to question hidden assumptions before they contaminate full‑scale designs.
Mastering the distinction between these two temperatures is not about memorizing a formula. It is about building an intuition for where heat and mass transfer truly converge—and where they let go. A pilot plant that makes that convergence visible turns a potential campaign‑ending error into a lifelong engineering insight.
Ready to move beyond theoretical approximations and equip your laboratory with a platform that catches these subtle, data‑destroying errors before they reach your final report? Contact Our Experts
Related Products
- Packed Bed Absorption Educational Unit Operations Pilot Plant
- Absorption and Desorption Educational Unit Operations Pilot Plant
- Multi-Functional Special Distillation Educational Pilot Plant
- Comprehensive Liquid-Liquid Extraction Pilot Plant for Engineering Education
- Educational Rotary Disc Liquid-Liquid Extraction Pilot Plant




