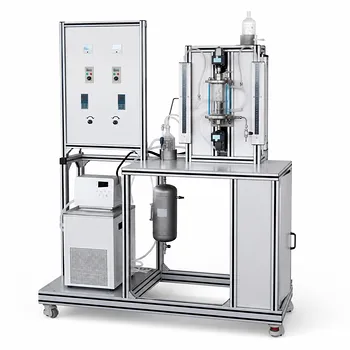
Straight to the point: A chemical engineering multiphase flow pilot plant allows you to visually observe and quantitatively analyze five distinct upward flow regimes in vertical tubes: bubble flow, slug flow, churn flow, wispy annular flow, and annular flow. Each pattern emerges from a specific balance of gas and liquid velocities, producing unique phase distributions that directly govern the pressure drop, heat transfer, and mass transfer behavior inside industrial piping and reactors.
The real value of a pilot plant is not just in seeing bubbles or slugs, but in connecting those visual signatures to the engineering calculations that dictate safe and efficient equipment design. Without that link, you’re only seeing half the picture.
The Five Classic Vertical Upward Flow Regimes
A transparent vertical test section, precisely controlled gas and liquid flows, and careful observation make these regimes unmistakable. They form a progression from a liquid‑dominated mixture to a gas‑core‑driven flow, each one carrying its own operational and design consequences.
Bubble Flow – Gentle Mixing at Low Gas Fractions
In bubble flow, numerous small gas bubbles are dispersed uniformly throughout the continuous liquid. This regime dominates when the gas velocity is low relative to the liquid, and the bubbles lack the momentum to coalesce into larger structures.
It provides the steadiest pressure drop signal and the most predictable interfacial area, which is why it’s often the target condition for mass‑transfer‑limited scrubbers and fermenters where gentle bulk mixing is needed.
Slug Flow – The Pulsating Instability
Slug flow is characterized by large bullet‑shaped gas pockets that can span several tube diameters, separated by liquid slugs that fill the entire pipe cross‑section. The liquid slugs accelerate and decelerate rhythmically, creating violent pressure fluctuations and mechanical vibration in connected equipment.
On a pilot plant, you can actually feel the slugs passing through the pipe, and the corresponding pressure‑drop trace swings dramatically. This regime is a critical concern for vertical risers in offshore oil‑and‑gas, where slug‑induced forces can damage structural supports.
Churn Flow – The Chaotic Transition
Often described as a “twisting, falling film” that becomes violently unsteady, churn flow marks the breakdown of stable slug flow. Gas velocities increase to the point where the liquid slugs destabilize, creating a frothy, disordered mixture with large chunks of liquid being tossed back and forth.
It is highly turbulent and visually erratic, making it one of the hardest regimes to model analytically. In a pilot plant, churn flow appears as a nearly opaque, oscillating mess that blurs the distinction between a continuous liquid slug and a gas core.
Wispy Annular Flow – The Bridging Phase
At the edge of fully developed annular flow, you encounter wispy annular flow. The bulk of the liquid still lines the wall as a film, but the central gas core carries large concentrations of liquid droplets that can stretch into elongated, wispy structures — essentially transients between a thick film and a fully dispersed droplet cloud.
It’s a subtle, fleeting regime that many quick glance‑and‑go observations miss. On a well‑instrumented pilot plant, you can spot it by the simultaneous presence of a thick wall film and short‑lived, thread‑like droplet clusters in the high‑speed gas stream.
Annular Flow – The Thin‑Film Gas Core
In fully developed annular flow, a thin liquid film creeps slowly upward along the wall, while the center of the tube is occupied by a high‑velocity gas core carrying only a very small fraction of suspended droplets. Most of the pressure drop now comes from the interfacial shear between the fast gas and the wavy liquid film.
This regime is the workhorse of once‑through boilers and vertical evaporators, where the thin liquid film provides high heat transfer coefficients with minimal liquid inventory.
Why Pilot Plants Are Essential for Regime Analysis
A transparent flow loop is more than a visual demo. It’s the bridge between textbook flow pattern maps and the unpredictable realities of industrial fluids.
Visual Identification and Controlled Flow Manipulation
By independently adjusting gas and liquid rotameters, operators can trace out the exact boundary where bubble flow transitions into slug flow, and slug flow dissolves into churn flow. The pilot plant eliminates the guesswork: you watch the pattern change in real time and record the corresponding superficial velocities for your specific pipe diameter and fluid properties.
This direct correlation is indispensable when tuning a reactor feed line or calibrating a computational fluid dynamics model.
Linking Flow Patterns to Pressure Drop Data
The biggest hidden benefit is the ability to simultaneously monitor differential pressure transducers. When the visual pattern shifts from slug to churn, the pressure drop signal changes from a periodic spike to a highly irregular noise‑dominated spectrum.
You can then calculate the mixture Reynolds number, determine the two‑phase Fanning friction factor, and verify whether standard empirical correlations (like Lockhart–Martinelli) hold for your specific chemistry—an exercise that teaches more about hydrodynamic modeling than any spreadsheet ever could.
Horizontal vs. Vertical: Understanding Gravity’s Influence
Many pilot plants offer both vertical and horizontal test sections. While the question focuses on vertical up‑flow, it is worth noting that simply tilting the pipe reveals how gravity stratifies the phases. In a horizontal section, you would see stratified, wavy, and plug/slug patterns, which starkly contrast with the symmetric annular and bubble regimes observed vertically.
This side‑by‑side comparison reinforces the engineer’s intuition for where gravity‑dominated and inertia‑dominated flow each belong in a plant layout.
Understanding the Trade‑offs
Pilot‑plant observations are powerful, but they come with limitations you must acknowledge to avoid overconfidence in your designs.
The Subjectivity of Visual Classification
Even with a clear glass tube, the transition from wispy annular to full annular flow is inherently subjective. Two trained observers might differ by 10–15 % in the recorded transition velocity. This ambiguity propagates directly into the empirical constants you later use for pressure drop predictions.
In an industrial context, this means you should always confirm regime‑dependent calculations with at least one indirect measurement, such as a sharp change in pressure drop slope or a tomographic void fraction measurement.
Geometric and Fluid Property Dependencies
Flow maps generated on a small‑diameter pilot plant (e.g., 25 mm tube) do not simply scale to large‑diameter columns. Surface tension effects become less dominant as pipe diameter increases, shifting the slug‑to‑churn and churn‑to‑annular transitions. Likewise, a viscous, foaming liquid will sustain bubble flow at far higher gas velocities than water, so a map built for water‑air won’t apply to your silicone‑oil process without adaptation.
Practical Limitations of Pilot‑Scale Data
A pilot plant cannot replicate the thermal and chemical gradients of a full‑scale reactive boiling flow. When evaporation is occurring along the tube, the flow regime changes rapidly with vapor quality, often passing through all five vertical patterns within a few meters of tube length.
Treat the pilot‑plant data as a calibration point for your fundamental models, not as a direct substitute for field‑verified performance curves in high‑flux boiling systems.
How to Apply This to Your Project
Your ideal use of the pilot plant depends on what you ultimately need to design or teach.
- If your primary focus is pressure drop prediction in vertical risers: Concentrate on recording the transition from slug to churn flow, because that’s where most empirical correlations diverge. Map the boundary precisely, then back‑calculate your two‑phase friction factor from the sensor data.
- If your primary focus is heat exchanger design under boiling conditions: Spend your time observing annular and wispy annular flow, because the thin‑film heat transfer coefficient is the key parameter. Vary the gas velocity and note when the wall film first dries out intermittently, signaling a dangerous peak in tube temperature.
- If your primary focus is student education or operator training: Use the full flow rate envelope to demonstrate how a single pipeline can experience all five regimes back‑to‑back, and have students correlate each visual pattern with its corresponding pressure‑drop trace. This builds the instinct that graphs and equations alone can't provide.
The true value of a multiphase pilot plant lies not in the list of regimes you see, but in the critical design decisions those observations empower you to make with confidence.
Summary Table:
| Flow Regime | Key Visual Characteristics | Engineering & Design Impact |
|---|---|---|
| Bubble Flow | Small gas bubbles dispersed in continuous liquid | Steady pressure drop; ideal for mass transfer |
| Slug Flow | Large bullet-shaped gas pockets; liquid slugs | Severe pressure fluctuations; vibration risks |
| Churn Flow | Chaotic, oscillating, frothy mixture | High turbulence; difficult to model analytically |
| Wispy Annular | Liquid film on wall; wispy droplet clusters in core | Transition phase; crucial for high-speed gas flows |
| Annular Flow | Thin liquid film on wall; gas core in center | High heat transfer; ideal for boilers & evaporators |
Elevate Your Chemical Engineering Lab with LABPARK
Ready to give your students and researchers hands-on experience with real-world fluid dynamics? LABPARK designs and manufactures high-quality Educational and Vocational Unit Operations Pilot Plants in chemical engineering, bioprocess & biotech, and environmental & water treatment.
Specifically tailored for universities, research institutes, and enterprises, our pilot plants provide clear visualization and precise data tracking to help you master complex flow regimes and validate mathematical models.
Contact our engineering experts today to find the perfect pilot plant for your curriculum or research goals!
Related Products
- Two Phase Flow Pattern Velocity Resistance Measurement Educational Pilot Plant
- Two-Dimensional Fluidization Hydrodynamics Educational Pilot Plant for Unit Operations Training
- Dual-Drive Stirred Gas-Liquid Mass Transfer Coefficient Determination Pilot Plant
- Ternary Liquid-Liquid Equilibrium Educational Pilot Plant
- Gas Phase Mixing and Residence Time Distribution Determination Educational Unit Operations Pilot Plant
People Also Ask
- How to update chemometric calibration models in pilot plants? Best practices for process engineers.
- Why Correct Sig Figs & Rounding Matter in Educational Pilot Plants: Ensure Data Accuracy
- How does nuclear yield inefficiency translate to chemical engineering education? Optimize kinetics with pilot plants.
- How can educational pilot plants be used to teach process safety and risk assessment in chemical engineering curricula?
- How to identify two-phase gas-liquid flow patterns? Master fluid dynamics with pilot plants