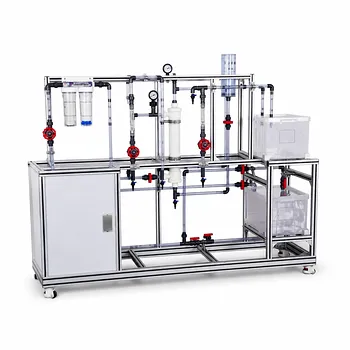
Membrane gas separation pilot plants are evaluated by combining operating data with steady-state component balances. The essential measurements are feed, permeate, and retentate flow rates; gas compositions; feed and permeate pressures; pressure drop; temperature; and membrane area or module configuration. Because the membrane is non-reactive, each chemical component entering the module must leave in either the permeate or retentate stream.
The central principle is conservation of moles: total and component balances establish the unknown stream flows and compositions, while pressure ratio, temperature, membrane selectivity, stage cut, and flow distribution explain why the separation performs as observed.
Define the Pilot Plant System Clearly
Treat the membrane module as the system boundary
For a steady-state membrane module, the feed enters the control volume and divides into two outlet streams:
- Feed: (F), with component mole fractions (z_i)
- Permeate: (P), with component mole fractions (y_i)
- Retentate: (R), with component mole fractions (x_i)
The membrane does not create or consume chemical species. It only distributes them differently between the permeate and retentate streams.
Distinguish retentate from waste
The retentate is often described as the waste stream, but that is not universally correct. Depending on the process objective, either the permeate or retentate may be the desired product.
This distinction matters when calculating recovery, purity, and process efficiency.
Apply the Material Balance Principles
Start with the overall molar balance
For a steady-state, non-reactive module:
[ F=P+R ]
If two of the three total flow rates are known, the third follows directly from this equation.
Use independent component balances
For each species (i):
[ Fz_i=Py_i+Rx_i ]
This equation states that the amount of component (i) entering with the feed must equal the amount leaving through the permeate and retentate.
For a binary mixture, one component balance plus the overall balance is usually sufficient because:
[ z_A+z_B=1 ]
[ y_A+y_B=1 ]
[ x_A+x_B=1 ]
Only independent equations should be used; otherwise, the calculation may be over-specified.
Prefer component flow rates when compositions are unknown
Writing balances directly in terms of mole fractions can produce nonlinear equations because both flow rates and compositions may be unknown. A more robust method is to define component molar flow rates, such as (F_i), (P_i), and (R_i).
The balance then becomes:
[ F_i=P_i+R_i ]
Total flow rates are obtained by summing the component flows:
[ F=\sum_i F_i,\qquad P=\sum_i P_i,\qquad R=\sum_i R_i ]
This sequential approach generally simplifies pilot-plant data reduction.
Measure the Parameters That Control Separation
Feed composition and flow rate
The feed composition determines the quantity of each species available for separation. Feed flow rate affects residence time, membrane loading, concentration polarization, and the fraction of feed that permeates.
Accurate feed analysis is therefore as important as accurate product-stream analysis.
Feed and permeate pressures
The membrane is driven by a difference in component chemical potential, commonly approximated through partial-pressure differences. Feed pressure is typically the high-pressure-side variable, while permeate pressure is controlled by downstream pressure or vacuum equipment.
The pressure ratio is commonly expressed as:
[ \text{Pressure ratio}=\frac{p_{\text{feed}}}{p_{\text{permeate}}} ]
A higher pressure ratio can increase the driving force, but it may also increase compression or vacuum energy requirements.
Pressure drop through the module
The pressure at the module inlet may differ from the pressure at the outlet. This pressure drop changes the local driving force and can cause the membrane to operate under nonuniform conditions.
Pilot evaluation should therefore record pressure at relevant locations rather than relying only on nominal inlet pressure.
Operating temperature
Temperature affects gas permeability, sorption, diffusion, viscosity, and the mechanical stability of polymeric membranes. It can therefore change both flux and selectivity.
Temperature should be monitored and held sufficiently stable when comparing different operating points.
Membrane properties and module design
Key membrane and module variables include:
- Permeability
- Intrinsic selectivity
- Membrane thickness
- Effective membrane area
- Hollow-fiber or flat-film geometry
- Flow distribution
- Sealing and tubesheet compatibility
For a dense polymer membrane using a solution-diffusion mechanism, a simplified flux relationship is:
[ J_i \propto \frac{P_i}{l}\left(p_{i,\text{feed}}-p_{i,\text{permeate}}\right) ]
where (J_i) is component flux, (P_i) is permeability, (l) is membrane thickness, and the pressure difference represents the driving force.
Permeability is commonly related to diffusion and solubility:
[ P_i=D_iS_i ]
Thus, a membrane’s performance depends on both how rapidly a species diffuses through the material and how strongly it dissolves into it.
Calculate the Main Performance Indicators
Stage cut
Stage cut is the fraction of feed that becomes permeate:
[ \theta=\frac{P}{F} ]
It is one of the most important operating indicators because it links flow split to product composition.
A higher stage cut may increase the amount recovered in the permeate, but it can also reduce product purity as more of the less-permeable species passes through.
Product purity
The purity of component (i) in a stream is its mole fraction. For example, the permeate purity is:
[ y_i=\frac{P_i}{P} ]
The retentate purity is:
[ x_i=\frac{R_i}{R} ]
Purity must always be reported together with flow rate or recovery; a very pure stream may contain only a small fraction of the feed component.
Component recovery
Recovery measures the fraction of a feed component appearing in the selected product stream. For component (i), permeate recovery is:
[ \text{Recovery}_{i,\text{perm}}=\frac{Py_i}{Fz_i} ]
Retentate recovery is:
[ \text{Recovery}_{i,\text{ret}}=\frac{Rx_i}{Fz_i} ]
For a non-reactive, steady-state system with complete accounting:
[ \text{Recovery}{i,\text{perm}}+\text{Recovery}{i,\text{ret}}=1 ]
Separation factor or selectivity
For a binary mixture, permeate separation factor can be expressed as:
[ \alpha_{\text{perm}}= \frac{y_A/y_B}{z_A/z_B} ]
A corresponding retentate expression can be defined using (x_A/x_B). These values indicate how strongly the membrane enriches one component relative to the feed.
The measured pilot-scale separation may differ from intrinsic membrane selectivity because of pressure drop, concentration polarization, module flow distribution, and non-ideal operating conditions.
Connect Material Balances to Process Behavior
Interpret pressure ratio correctly
Increasing the feed-to-permeate pressure ratio generally increases the permeation driving force. However, the resulting improvement in flux or recovery must be weighed against compressor power, vacuum requirements, mechanical limits, and possible changes in selectivity.
Pressure ratio is therefore both a mass-transfer variable and an energy-design variable.
Evaluate flow distribution
Poor flow distribution can produce regions of excessive or insufficient membrane loading. This reduces the usefulness of average inlet and outlet measurements because the module may not be operating uniformly.
Pilot testing should examine whether the module geometry provides effective contact with acceptable pressure loss.
Account for concentration polarization
As preferentially permeating species are removed near the membrane surface, the local feed composition can differ from the bulk feed composition. This phenomenon can reduce the effective driving force and lower observed separation performance.
Pilot results should therefore be interpreted using actual module conditions, not only intrinsic material data measured on small membrane samples.
Separate intrinsic and apparent performance
Intrinsic selectivity describes the membrane material under controlled conditions. Apparent module selectivity reflects the combined effects of membrane material, defects, support resistance, pressure variation, flow distribution, and measurement uncertainty.
This distinction is essential when deciding whether poor performance is caused by the membrane itself or by module design and operation.
Understanding the Trade-offs
Purity versus recovery
Operating conditions that maximize the purity of one product may reduce the quantity of that product recovered. Conversely, increasing stage cut can improve throughput or recovery while allowing more of the undesired component to permeate.
Pilot evaluation should report both values rather than treating purity alone as the measure of success.
Permeability versus selectivity
Highly permeable membranes can provide high flux and smaller membrane area, while highly selective membranes can produce better separation. These properties do not always increase together.
The appropriate choice depends on the required product purity, recovery, membrane area, pressure ratio, and energy consumption.
Flux versus energy use
Higher feed pressure or lower permeate pressure can increase flux. The benefit may be offset by the energy required for compression or vacuum generation.
A technically strong evaluation therefore includes operating energy implications, not only calculated separation performance.
Laboratory assumptions versus pilot conditions
Ideal calculations may assume constant pressure, constant temperature, perfect sealing, and uniform flow. Real pilot modules can experience pressure gradients, leaks, membrane aging, support resistance, and analytical errors.
Mass-balance closure should be checked before using the results to compare membrane materials or scale the process.
Treating all measured streams as independent
Flow rates and compositions are constrained by conservation equations. Entering inconsistent measurements into the calculation can create an apparent imbalance that is caused by instrumentation rather than membrane behavior.
Use calibrated instruments, consistent sampling locations, and a closure check for both total flow and individual components.
How to Apply This to Your Pilot Plant
Begin with a measurement plan that captures feed, permeate, and retentate conditions at the same stable operating state.
- If your primary focus is material-balance closure: Measure total flow rates and independent component compositions, then verify (F=P+R) and (Fz_i=Py_i+Rx_i) for every relevant species.
- If your primary focus is membrane separation performance: Calculate stage cut, product purity, component recovery, and separation factor at each operating condition.
- If your primary focus is process optimization: Vary feed pressure, permeate pressure, pressure ratio, temperature, flow rate, and stage cut while tracking purity, recovery, flux, and energy requirements.
- If your primary focus is scale-up: Compare intrinsic membrane properties with measured module performance and account for membrane area, geometry, pressure drop, flow distribution, sealing, and concentration polarization.
- If your primary focus is troubleshooting: Check mass-balance closure first, then investigate leaks, sampling error, pressure gradients, temperature variation, and nonuniform module flow.
A reliable pilot-plant evaluation connects conservation-based calculations with the operating conditions that determine real membrane performance.
Summary Table:
| Evaluation area | Key measurements or variables | Main calculation or insight |
|---|---|---|
| Material balance | Feed, permeate, and retentate flows and compositions | Verify F = P + R and Fz_i = Py_i + Rx_i |
| Driving force | Feed pressure, permeate pressure, and pressure ratio | Higher pressure differences generally increase permeation |
| Operating conditions | Temperature, flow rate, and module pressure drop | Explain changes in flux, selectivity, and flow distribution |
| Membrane and module | Permeability, selectivity, thickness, area, and geometry | Distinguish intrinsic membrane behavior from module performance |
| Separation performance | Stage cut, purity, recovery, and separation factor | Quantify product quality and component distribution |
| Scale-up and troubleshooting | Energy use, leaks, concentration polarization, and mass-balance closure | Identify measurement, design, or operating limitations |
Planning or improving a membrane gas separation pilot plant? Contact LABPARK to discuss a system matched to your objectives. LABPARK provides Educational and Vocational Unit Operations Pilot Plants for chemical engineering, bioprocess and biotech, and environmental and water treatment applications. Universities, research institutes, and enterprises can work with our team to evaluate material balances, pressure and temperature effects, stage cut, purity, recovery, membrane area, module configuration, and scale-up requirements through practical pilot-plant solutions.
Related Products
- Multifunctional Membrane Separation Educational Pilot Plant with Ultrafiltration, Nanofiltration, Reverse Osmosis
- Ultrafiltration Membrane Separation Educational Pilot Plant
- Multi-Functional Membrane Separation Educational Pilot Plant for Unit Operations Lab
- Photocatalytic Membrane Separation and Degradation Unit Operations Pilot Plant
- Hollow Fiber Ultrafiltration Membrane Separation Educational Pilot Plant
People Also Ask
- Pervaporation vs. Vapor Permeation: Handling Suspended Solids in Membrane Pilot Plants
- How do PEI, PVDF, and PSU membranes compare in pilot plants? Find the best fit.
- What are the trade-offs of polymer vs inorganic membranes in teaching pilot plants? Key laboratory comparison.
- What are the key flow configuration loops in membrane pilot plants? Optimize Performance
- How can operators optimize operating conditions and cleaning protocols in membrane separation pilot plants to mitigate fouling?