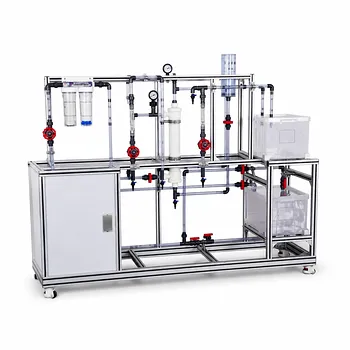
Local transmembrane pressure variation changes both permeate flux and the axial flow field. In an in-line membrane filtration pilot plant, the local permeation velocity is approximately proportional to the local transmembrane pressure (TMP) through the membrane’s hydraulic permeability. As permeate leaves the feed channel, the axial flow rate and velocity change along the membrane, which in turn alters frictional pressure drop and the TMP available farther downstream. Pressure drop and permeate collection must therefore be modeled as a coupled, spatially varying problem rather than as independent inlet-to-outlet calculations.
Core takeaway: A high local TMP increases permeate flux, but the resulting fluid removal changes the axial velocity profile and pressure loss. Accurate pilot-plant modeling requires solving membrane transport and channel pressure drop together along the flow direction.
Why Local TMP Matters
TMP Determines Local Permeate Flux
The local transmembrane flux can be represented by a resistance-based relation:
[ J(z) = \frac{\Delta P_{\mathrm{TMP}}(z)} {\mu \left[R_m + R_g(z) + R_f(z)\right]} ]
where (J) is the local permeate flux, (\Delta P_{\mathrm{TMP}}) is the local TMP, (\mu) is viscosity, and (R_m), (R_g), and (R_f) represent membrane, gel-layer, and fouling resistances.
If the resistance terms are defined to include viscosity, the viscosity factor is omitted. The important relationship is that flux responds to local pressure difference and local resistance, not simply to the average pressure across the unit.
TMP Varies Along the Membrane
For a membrane channel, local TMP is determined by the pressure difference between the feed-side fluid and the permeate-side fluid:
[ \Delta P_{\mathrm{TMP}}(z)
P_f(z) - P_p(z) ]
Both pressures may vary with axial position. Feed-side pressure generally falls because of frictional pressure drop, while permeate-side pressure may also change because of permeate-channel resistance, collection geometry, or backpressure.
As a result, the same membrane may experience substantially different driving forces at its inlet and outlet.
Pressure Variation Creates Uneven Membrane Loading
Where TMP is higher, the membrane tends to produce more permeate, provided fouling and concentration polarization do not offset the pressure increase. Where TMP is lower, local flux decreases and less permeate is collected.
This produces a nonuniform flux distribution. A model based only on average TMP can therefore misrepresent local fouling, concentration polarization, permeate recovery, and the required membrane area.
How Permeation Changes Pressure Drop
Axial Flow Decreases as Permeate Leaves
Permeate extraction removes fluid from the feed channel. The local axial volumetric flow rate therefore decreases with distance along the membrane:
[ \frac{dQ}{dz} = -wJ(z) ]
where (Q(z)) is the axial feed flow rate, (w) is the membrane width exposed to filtration, and (J(z)) is the local permeate flux.
For a channel of approximately constant cross-sectional area, the mean axial velocity also decreases:
[ u(z) = \frac{Q(z)}{A} ]
This is the liquid-phase analogue of variable-velocity flow in other pilot-plant unit operations: local removal changes the flow conditions used to calculate downstream pressure loss.
Lower Axial Velocity Usually Reduces Frictional Loss
Under lubrication-flow assumptions, the pressure gradient is related to the local axial flow rate. For a simple slit-like channel, the relationship has the general form
[ -\frac{dp}{dz} \propto \frac{\mu Q(z)}{h^3 w} ]
where (h) is the channel gap and (w) is the channel width.
As (Q(z)) declines because of permeation, the local axial pressure gradient also declines. Consequently, a permeable channel can have a lower total axial pressure drop than an otherwise identical impermeable channel carrying the original inlet flow throughout its length.
The Pressure Drop Is Coupled to the Flux Profile
The coupling works in both directions:
- Local TMP determines (J(z)).
- (J(z)) determines how quickly axial flow decreases.
- Axial flow determines the local frictional pressure gradient.
- The pressure profile determines TMP farther downstream.
This feedback means that the pressure profile cannot generally be prescribed independently of the membrane flux profile.
How to Model an In-Line Pilot Plant
Define the Local State Variables
A practical one-dimensional model typically tracks:
- Feed-side pressure, (P_f(z))
- Permeate-side pressure, (P_p(z))
- Axial feed flow, (Q(z))
- Local TMP, (\Delta P_{\mathrm{TMP}}(z))
- Local permeate flux, (J(z))
- Membrane, gel, and fouling resistances
The model should also include viscosity, channel dimensions, membrane permeability, inlet conditions, outlet conditions, and any permeate-side hydraulic resistance.
March Along the Membrane
The channel can be divided into small axial segments (\Delta z). At each segment, the model should:
- Calculate local TMP from feed and permeate pressures.
- Calculate local resistance and permeate flux.
- Remove the corresponding permeate flow from the axial feed stream.
- Recalculate the axial velocity.
- Update feed-side pressure using the local hydraulic pressure gradient.
- Update permeate-side pressure if permeate-channel losses are significant.
A numerical marching procedure, such as an explicit Euler method, is often sufficient for an initial pilot-plant model:
[ Q_{i+1}
Q_i - wJ_i\Delta z ]
[ P_{f,i+1}
P_{f,i} + \left(\frac{dp_f}{dz}\right)_i\Delta z ]
The segment size must be small enough to resolve meaningful changes in pressure, flux, and resistance.
Use Boundary Conditions Consistently
The model may be specified using feed inlet pressure and permeate outlet pressure, or using flow and pressure conditions at different boundaries. These choices affect whether the problem is a straightforward initial-value calculation or requires an iterative solution.
For example, if both feed and retentate pressures are fixed while permeate-side pressure is also prescribed, the model may need to adjust an unknown inlet flow or flux distribution to satisfy all conditions simultaneously.
Check Conservation
The integrated permeate flow should equal the difference between inlet and retentate feed flow:
[ Q_{\mathrm{perm,total}}
Q_{\mathrm{feed,in}}
Q_{\mathrm{retentate,out}} ]
This mass-balance check is essential. A pressure profile may appear physically reasonable while still producing an incorrect total permeate flow if the local flux integration is inconsistent.
What the Model Reveals About Pilot-Plant Performance
Permeate Collection May Be Nonuniform
A local TMP maximum does not automatically guarantee the highest useful permeate production. Higher flux can increase concentration polarization or fouling, raising (R_g) or (R_f) and reducing the effective flux response.
The measured permeate flow should therefore be interpreted together with axial pressure, feed flow, and resistance data.
Retentate Flow Controls Downstream Conditions
As filtration proceeds, the retentate flow becomes smaller. This changes channel Reynolds number, shear conditions, and frictional pressure loss along the module.
In a cross-flow system, the declining axial flow can also affect the sweeping action that limits gel-layer and fouling accumulation. The hydraulic benefit of lower pressure drop may therefore coincide with a change in mass-transfer conditions.
Fiber and Channel Geometry Matter
In hollow-fiber systems, permeation through the wall reduces the axial mean velocity. Under the simplified assumptions of constant properties and uniform wall permeation, the velocity can be represented as
[ u(z) = u_0 - \frac{2v_w z}{R} ]
where (u_0) is inlet velocity, (v_w) is normal wall velocity, and (R) is the fiber radius.
This result illustrates the general principle: wall flux changes axial velocity, and axial velocity changes pressure drop. The exact equation depends on geometry and assumptions, so a flat-channel model should not be transferred directly to a hollow-fiber module without modification.
Understanding the Trade-offs
Higher TMP Does Not Always Improve Productivity
Increasing TMP raises the immediate driving force for permeation, but it may also accelerate pore blocking, cake formation, gel-layer growth, or irreversible fouling.
The useful operating range is therefore determined by sustained flux and product quality, not by the highest initial flux.
Average TMP Can Hide Local Problems
Using a single average TMP simplifies calculations but can conceal a low-flux outlet region or an overloaded inlet region. This may lead to incorrect estimates of membrane area, fouling rate, and permeate recovery.
Average-pressure models are most defensible when axial pressure variation is demonstrably small relative to the operating TMP.
Excessive Module Length Can Reduce Model Validity
If permeation removes too much axial flow, the velocity may approach zero near the downstream end. For the hollow-fiber scaling described in the references, maintaining a meaningful axial-flow regime requires a length well below
[ L \ll \frac{u_0R}{2v_w} ]
When this condition is not satisfied, assumptions such as nearly uniform velocity scale, simple lubrication flow, or weak axial variation may fail.
TFF and NFF Behave Differently
In normal-flow filtration, material is driven directly toward the membrane, which can promote rapid cake formation and flux decay. Tangential-flow filtration uses cross-flow to sweep the membrane surface and generally limits gel-layer and fouling buildup.
A model that includes TMP but ignores cross-flow-dependent resistance can therefore overpredict long-term flux, particularly in TFF operation.
Making the Right Choice for Your Goal
Use a spatially resolved coupled model when pressure variation, permeate-side resistance, fouling, or module scale is significant.
- If your primary focus is pressure-drop prediction: Couple the axial flow balance to a lubrication or channel-friction relation, updating the local velocity after each permeation step.
- If your primary focus is permeate recovery: Integrate local flux from the local feed and permeate pressures rather than multiplying membrane area by an average flux.
- If your primary focus is fouling behavior: Include gel-layer and fouling resistance as functions of local flux and cross-flow conditions.
- If your primary focus is pilot-plant scale-up: Measure axial pressure, feed flow, permeate flow, and filtrate flux so the spatial model can be checked against distributed operating data.
A reliable in-line membrane model treats pressure, axial flow, permeation, and resistance as mutually dependent variables rather than separate calculations.
Summary Table:
| Key factor | Effect on the system | Modeling implication |
|---|---|---|
| Local TMP | Determines permeate flux at each membrane position | Calculate flux from local feed and permeate pressures |
| Permeate removal | Reduces axial feed flow and velocity | Update flow rate and velocity along the membrane |
| Axial pressure drop | Lowers feed-side pressure downstream | Couple channel friction with permeation |
| Permeate-side resistance | Changes local TMP through pressure variation | Include permeate-channel losses when significant |
| Fouling and gel resistance | Reduces effective flux and increases resistance | Model resistance as a function of local conditions |
| Module geometry | Controls hydraulic behavior and velocity profiles | Use geometry-specific equations for flat channels or hollow fibers |
| Boundary conditions | Determine whether inlet flow or pressure must be solved iteratively | Apply feed, retentate, and permeate conditions consistently |
| Conservation check | Confirms total permeate equals feed flow loss | Verify integrated permeate flow against the mass balance |
Planning an in-line membrane filtration pilot plant or improving an existing process? Contact LABPARK for Educational and Vocational Unit Operations Pilot Plants designed for universities, research institutes, and enterprises. Our chemical engineering, bioprocess and biotech, and environmental and water treatment systems help you evaluate local TMP, pressure drop, permeate recovery, fouling behavior, and scale-up performance with practical pilot-plant data. LABPARK can help you select the right membrane filtration configuration, integrate measurement points for feed and permeate pressure, and build a reliable experimental foundation for process development, teaching, research, and industrial validation.
Related Products
- Ultrafiltration Membrane Separation Educational Pilot Plant
- Multifunctional Membrane Separation Educational Pilot Plant with Ultrafiltration, Nanofiltration, Reverse Osmosis
- Hollow Fiber Ultrafiltration Membrane Separation Educational Pilot Plant
- Multi-Functional Membrane Separation Educational Pilot Plant for Unit Operations Lab
- Multi Functional Membrane Crystallization Educational Unit Operations Pilot Plant
People Also Ask
- How do PEI, PVDF, and PSU membranes compare in pilot plants? Find the best fit.
- Pervaporation vs. Vapor Permeation: Handling Suspended Solids in Membrane Pilot Plants
- Isotropic vs. Anisotropic Membranes: How to Choose the Best Pilot Plant Modules
- Why Use a Membrane Separation Pilot Plant vs. Lab Testing? Avoid Costly Scale-Up Failures
- How do membrane pilot plants demonstrate synthetic vs biological membrane advantages?