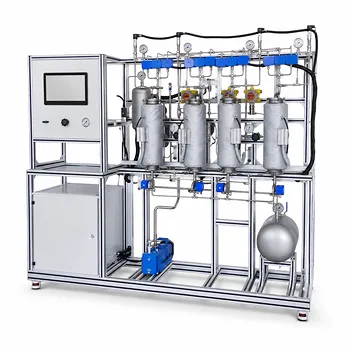
While industrial columns are engineered to avoid it, unit operations pilot plants are purpose-built to let students safely push a column into flooding. These systems are equipped with precise differential pressure sensors and flow controllers, allowing learners to systematically generate experimental pressure drop curves. They can visually and quantitatively identify the critical loading and flooding points, bridging the gap between abstract design equations and real physical column behavior.
The central takeaway: Educational pilot plants transform the theoretical concepts of pressure drop and flooding into a visceral, data-driven experience. By letting students create their own hydraulic performance curves, they internalize why columns are operated at specific design fractions of flooding velocity—and what happens when those limits are exceeded.
How Pilot Plants Are Designed to Showcase Column Hydrodynamics
Unlike their industrial counterparts, which are tightly constrained to safe operating windows, educational pilot plants are configured to demonstrate the full spectrum of hydrodynamic regimes. The goal is to provide students with a safe, repeatable, and measurable transition from stable countercurrent flow to complete flooding.
A Purpose-Built Platform for Failure Analysis
The core instrumentation—differential pressure transmitters across the packed bed—forms the heart of the learning experience. High-accuracy pressure sensors capture the subtle changes in resistance that precede flooding, long before any visual signs appear.
These plants grant fine-grained control over gas and liquid rates. Students can meticulously increase the gas velocity while holding the liquid rate constant, or vary the liquid-to-gas ratio, systematically mapping the column's response. This turns a design boundary into an experimental variable, making the concept of "flooding velocity" tangible.
Packing, Trays, and Visual Feedback
Many pilot columns use transparent sections, letting students directly observe the accumulation of liquid in the packing voids—the visual signature of loading and the chaotic entrainment of flooding. Combined with real-time pressure drop readings, this creates a powerful mental model.
Systems may feature interchangeable internals: packed beds, sieve trays, or valve trays. Each geometry produces a distinct pressure drop signature and flooding behavior, teaching students that column hydrodynamics are a direct function of internal design.
Mapping the Journey from Stable Operation to Flooding
The primary pedagogical exercise involves generating an experimental pressure drop curve. This single graph unlocks the entire narrative of column fluid dynamics.
The Loading Point: Where Order Begins to Break
At low gas velocities, the pressure drop is predictable and modest. As the gas rate increases, a distinct deviation from the dry packing curve appears—the loading point. Here, liquid hold-up in the packing begins to noticeably increase, narrowing the gas passages and causing the pressure drop to rise more steeply.
Students learn to identify the loading point not as a failure, but as the practical upper bound of the column's stable operating range. Industrial designs target operation below this point to ensure efficiency and reliability.
The Flooding Point: The Cliff Edge
A marginal increase in gas velocity beyond the loading point can trigger a runaway effect. At the flooding point, the pressure drop spikes almost vertically. Gas no longer flows through discrete channels; it blocks the liquid downflow entirely, causing liquid to accumulate catastrophically.
The pilot plant makes this clear quantitatively—a sudden, unstable pressure drop reading—and qualitatively, with liquid visibly backing up and potentially being ejected from the column top. This hands-on demonstration cements the understanding that flooding is an absolute operational limit, not a gradual degradation.
Validating the Generalized Pressure Drop Correlation
With raw data in hand, students can overlay their experimental curve on the Generalized Pressure Drop Correlation (GPDC) chart. This empirical framework, which plots capacity parameters against flow ratios, was designed to predict flooding from fluid properties and packing factor.
Pilot plant experiments allow learners to see how changing the liquid rate shifts the curve and how different packing factors alter the flooding velocity. The correlation ceases to be an esoteric graph and becomes a model they have validated with their own hands.
Distillation vs. Absorption: The Same Physics, Different Drivers
While both units rely on countercurrent vapor-liquid contact, the mechanisms driving pressure drop and flooding manifest differently—and pilot plants allow side-by-side comparison.
The Thermal Overlay of Distillation
In distillation, the vapor phase is generated by heating. Higher vapor velocities are often a direct consequence of higher reboiler duties. A pilot distillation column demonstrates how excessive heat input not only wastes energy but can directly flood the column, destroying separation performance.
This teaches a critical control principle: flooding in distillation is often a thermal management problem. The solution might involve reducing heat input, not just adjusting flow paths.
The Liquid-Controlled Nature of Absorption
In gas absorption, the liquid phase is introduced externally and operates far below its boiling point. Flooding is primarily a mass flow issue, driven by an imbalance between the gas velocity and the absorbent circulation rate.
By observing an absorption pilot plant, students see that flooding can occur even with a cold solvent. They also learn why a minimum pressure drop is essential—without sufficient gas resistance, the liquid may not distribute evenly across the packing, a lesson that directly connects to industrial vacuum distillation and absorption design.
Debottlenecking and the Practical Value of Understanding Limits
When a column reaches its hydraulic limit, the pilot plant becomes a laboratory for capacity expansion. By swapping to packing with a lower packing factor, increasing the column diameter, or adding modular pre-fractionation stages, students can directly measure the resulting shift in the flooding curve. This transforms abstract process debottlenecking theory into a measurable, physical intervention, demonstrating why capital-intensive solutions are sometimes the only answer.
Understanding the Limitations of Educational Demonstrations
For all their instructional power, pilot plants are scaled-down models. Their behavior is not a one-to-one substitute for industrial columns. Acknowledging their limitations is crucial for graduating an informed engineer.
Scale and Wall Effects
Small-diameter columns exhibit exaggerated wall effects, where liquid preferentially flows down the column wall rather than through the packing. This can cause pressure drop readings to deviate from the predictions of correlations designed for industrial-scale towers.
Students must learn to recognize these artifacts and appreciate that pilot data is foundational but must be scaled with caution. The goal is conceptual clarity, not a direct transfer of data.
The Danger of Over-Practicing Failure
Driving a column repeatedly into severe flooding can stress the packing and internals. In a real plant, the economic consequences are massive. The pilot plant must be treated with the same respect as an industrial asset, rewarding students who can identify the loading point and proactively avoid the flooding cliff—the exact discipline required in professional practice.
Applying These Lessons to Your Engineering Intuition
The ability to connect a pressure drop reading to the fluid mechanics inside a column is a core competency for any process engineer. The pilot plant's greatest gift is a calibrated intuition—an internal model of what "normal," "loading," and "flooding" actually feel like.
- If your primary focus is mastering design fundamentals: Use the pilot plant to verify the generalized pressure drop correlation for at least three different liquid-to-gas ratios. The goal is to build a mental library of where loading occurs relative to industrial design limits.
- If your primary focus is operational troubleshooting: Deliberately induce light loading conditions and practice recovering by reducing either gas flow or reboiler duty. Train yourself to recognize the early pressure drop signatures that precede flooding before they become visually obvious.
- If your primary focus is optimizing column throughput: Experiment with alternative internals, such as switching between structured packing and random packing of different sizes, and plot their full hydraulic performance diagrams to map a column’s true operating window.
Hands-on pilot plant work transforms pressure drop from a number on a datasheet into a living, dynamic story of the column telling you exactly how close it is to its limit.
Summary Table:
| Stage | Key Indicators | Pressure Drop Trend | Educational Insight |
|---|---|---|---|
| Stable Operation | Low liquid hold-up, clear countercurrent flow | Low, predictable rise | Baseline for normal column operations. |
| Loading Point | Liquid hold-up increases; narrowed gas channels | Deviation from dry curve, steeper rise | Represents the upper safety limit of design. |
| Flooding Point | Catastrophic liquid accumulation, entrainment | Sudden, vertical spike | Demonstrates the absolute operational limit. |
Bring Hands-On Chemical Engineering to Your Lab
Looking to bridge the gap between classroom theory and real-world process dynamics? LABPARK provides state-of-the-art Educational and Vocational Unit Operations Pilot Plants in chemical engineering, bioprocess & biotech, and environmental & water treatment. Designed specifically for universities, research institutes, and enterprises, our pilot plants offer:
- Clear Visual Feedback: Transparent columns to observe loading and flooding in real-time.
- Industrial-Grade Instrumentation: High-precision sensors to generate accurate hydraulic curves.
- Versatile Configurations: Modular internals (packed beds, sieve trays) for comprehensive testing.
Equip your students and researchers with the tools they need to master column hydrodynamics. Contact LABPARK today to request a quote or customize your pilot plant!
Related Products
- Multi-Component Gas Pressure Swing Adsorption Pilot Plant for Unit Operations Education
- Packed Bed Absorption Educational Unit Operations Pilot Plant
- Dual-Mode Gas Absorption and Desorption Unit Operations Training Pilot Plant
- Continuous Sieve-Plate Distillation Pilot Plant for Unit Operations Laboratory Education
- Absorption and Desorption Educational Unit Operations Pilot Plant
People Also Ask
- How does Pressure Swing Adsorption (PSA) technology operate? Optimize gas separation with pilot plants.
- How is the direction and driving force of mass transfer determined in a gas absorption unit operations pilot plant?
- How do two-film & penetration theories apply to gas absorption pilot plant teaching? Key pedagogical insights.
- How does partial pressure behavior influence gas absorption pilot plants? Master Mass Transfer
- What are the limitations of Henry's Law in gas absorption pilot plants? Avoid critical lab errors.