Counter-current gas recovery is modeled by conserving both total flow and the target solute between the gas and liquid streams. For a steady-state absorber without chemical reaction, engineers write an overall mass balance and a component balance around the column, then combine them with an equilibrium or empirical gas–liquid relationship. These equations predict outlet flow rates, solute recovery, solvent demand, and column performance.
Core takeaway: The solute balance determines how much gas component transfers into the liquid, while the total and inert-component balances determine how the gas and liquid flow rates change. The resulting operating line, combined with equilibrium data, provides the basis for predicting counter-current absorber behavior.
Establishing the Counter-Current Absorber Model
Define the streams and system boundary
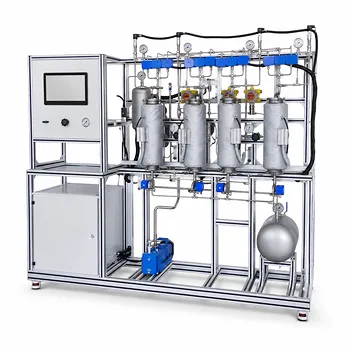
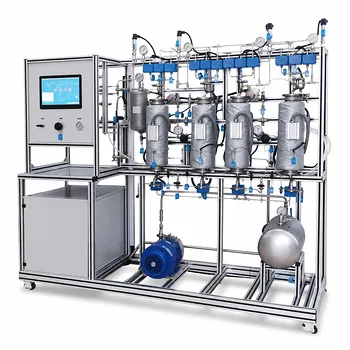
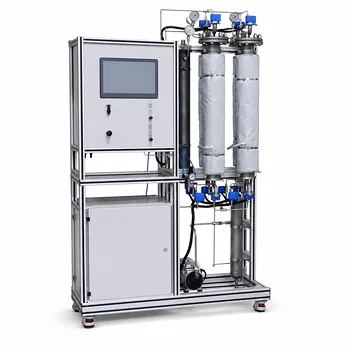
A typical pilot plant contains a gas mixture entering near the bottom of a packed or staged column and a solvent entering near the top.
For a soluble gas component (A), such as ammonia in nitrogen:
- (G_{\text{in}}), (G_{\text{out}}): total gas mass or molar flow rates
- (L_{\text{in}}), (L_{\text{out}}): total liquid mass or molar flow rates
- (y_A): solute fraction in the gas phase
- (x_A): solute fraction in the liquid phase
The calculation basis must be consistent. Engineers use either mass fractions with mass flow rates or mole fractions with molar flow rates.
Apply the overall balance
For steady operation without accumulation, the total inlet flow equals the total outlet flow:
[ G_{\text{in}}+L_{\text{in}}
G_{\text{out}}+L_{\text{out}} ]
This balance alone does not reveal how much of component (A) transfers between phases. It only ensures that the total material entering the column is accounted for.
Apply the solute balance
The component balance on (A) is:
[ G_{\text{in}}y_{A,\text{in}} + L_{\text{in}}x_{A,\text{in}}
G_{\text{out}}y_{A,\text{out}} + L_{\text{out}}x_{A,\text{out}} ]
For a fresh solvent, (x_{A,\text{in}}) may be approximately zero. The decrease in solute carried by the gas then appears primarily as an increase in solute carried by the liquid.
The absorbed solute rate can be expressed from either side:
[ \dot m_{A,\text{absorbed}}
G_{\text{in}}y_{A,\text{in}}
G_{\text{out}}y_{A,\text{out}} ]
or
[ \dot m_{A,\text{absorbed}}
L_{\text{out}}x_{A,\text{out}}
L_{\text{in}}x_{A,\text{in}} ]
These two results should agree within measurement and modeling uncertainty.
Using Inert Components to Determine Flow Rates
Treat the carrier gas as conserved
If the gas contains an inert carrier, such as nitrogen, that component does not enter the liquid and does not react. Its balance is:
[ G_{\text{in}}y_{I,\text{in}}
G_{\text{out}}y_{I,\text{out}} ]
where (I) denotes the inert gas.
This relationship is especially useful when the total gas flow changes because the soluble gas is removed. Measured inlet and outlet inert concentrations can therefore be used to infer the outlet gas flow.
Distinguish total flow from solute-free flow
In many absorber calculations, gas and liquid flow rates are treated as approximately constant when the solute concentration is dilute. At higher concentrations, however, absorption changes the total phase flow rates.
A more rigorous model tracks the solute-free gas and liquid flow rates separately, because the inert gas remains in the gas phase while absorbed solute increases the liquid flow.
Calculate recovery
The gas-phase recovery or removal of component (A) is commonly calculated as:
[ \text{Recovery}
\frac{ G_{\text{in}}y_{A,\text{in}}
G_{\text{out}}y_{A,\text{out}} }{ G_{\text{in}}y_{A,\text{in}} } \times 100% ]
If the inlet and outlet gas flow rates are effectively equal, this simplifies to:
[ \text{Recovery} \approx \frac{ y_{A,\text{in}}-y_{A,\text{out}} }{ y_{A,\text{in}} } \times 100% ]
The unsimplified form is preferable when absorption materially changes the gas flow.
Constructing the Operating Line
Relate gas and liquid compositions
A balance over a section of the column gives the relationship between the gas and liquid solute concentrations. Under constant-flow assumptions, this relationship is linear:
[ y_A = m x_A+b ]
The slope is related to the liquid-to-gas flow ratio:
[ m=\frac{L}{G} ]
The exact intercept depends on the chosen coordinate basis and boundary conditions. In a common formulation, it is determined by the solute concentration in the exiting gas and the entering liquid.
Interpret the operating line physically
The operating line describes the actual material-balance path through the column. It is not an equilibrium relationship; it shows which gas and liquid compositions must coexist locally to satisfy conservation.
For a differential balance written with weight fractions, the slope may appear as:
[ \frac{ (w_{\text{gas}}){\text{out}}-(w{\text{gas}}){\text{in}} }{ (w{\text{liquid}}){\text{out}}-(w{\text{liquid}})_{\text{in}} }
-\frac{F_{\text{liquid}}}{F_{\text{gas}}} ]
The negative sign reflects the opposing concentration changes under the selected plotting convention. A consistent definition of stream direction and axis variables is essential.
Compare the operating line with equilibrium data
The equilibrium relationship, often written as (y_A^*=f(x_A)), describes the gas and liquid compositions that would coexist at equilibrium.
The difference between the operating line and the equilibrium curve represents the driving force for mass transfer. A larger separation generally indicates a larger driving force, while convergence between the two indicates reduced transfer potential or approach to a pinch condition.
Modeling the Column Internally
Stagewise approach
For a staged absorber, each ideal stage is modeled with:
- A total balance
- A gas-phase solute balance
- A liquid-phase solute balance
- An equilibrium relationship between exiting gas and liquid compositions
The model can then be solved stage by stage, or represented graphically by stepping between the operating line and equilibrium curve.
The number of theoretical stages predicted this way is compared with the actual pilot column performance.
Differential packed-column approach
A packed column is commonly represented by differential balances along its height. The local transfer of solute is related to a mass-transfer coefficient and the local gas–liquid driving force.
The balances track how (y_A) decreases in the rising gas and how (x_A) increases in the descending liquid. Integrating these equations from one column end to the other predicts the outlet compositions and required packing height.
Multicomponent and numerical models
When several soluble species are present, each component requires its own balance and phase-equilibrium relationship. The equations become coupled because the species share gas and liquid flow rates and may influence one another's equilibrium behavior.
Counter-current models are often boundary-value problems: gas conditions are specified at one end and liquid conditions at the other. Numerical algorithms may therefore guess an outlet condition, integrate through the column, and iterate until the opposite boundary condition is satisfied.
Connecting the Model to Pilot-Plant Measurements
Required measurements
Pilot-plant calculations typically use:
- Gas and liquid inlet flow rates
- Gas and liquid outlet flow rates, where available
- Inlet and outlet solute concentrations
- Temperature and pressure
- Solvent composition
- Inert-gas concentration
Gas composition may be reported as mole fraction, mass fraction, volume fraction, or concentration units such as parts per million. These quantities must be converted consistently before entering the balances.
Validate the balance experimentally
A useful diagnostic is to calculate absorbed solute from both the gas-side and liquid-side balances. Significant disagreement can indicate sampling errors, leaks, unsteady operation, evaporation, condensation, or an incorrect assumption about solvent composition.
The total balance should also close within an acceptable experimental error:
[ \text{Balance closure}
\frac{\text{total in}-\text{total out}}{\text{total in}} \times 100% ]
Use equilibrium or empirical data
The mass balance predicts what compositions are permitted by conservation. It does not, by itself, predict how rapidly or how completely mass transfer occurs.
An equilibrium curve, Henry’s-law relationship, or experimentally fitted distribution relationship is therefore needed to connect outlet compositions with the phase behavior of the specific solute–solvent system.
Understanding the Trade-offs
Increasing the liquid-to-gas ratio
A higher (L/G) ratio generally provides more solvent capacity and can reduce the solute concentration in the exiting gas.
The trade-off is increased solvent circulation, pumping duty, equipment loading, and potentially higher downstream regeneration requirements.
Decreasing the liquid-to-gas ratio
A lower (L/G) ratio reduces solvent demand but brings the liquid closer to saturation. This can lower the mass-transfer driving force and increase the residual solute concentration in the exit gas.
Very low solvent rates can also cause poor wetting in packed columns, reducing effective contact area.
Assuming constant flow rates
Constant (G) and (L) simplify the operating-line calculation and are often reasonable for dilute absorption.
The assumption becomes unreliable when the absorbed solute is a substantial fraction of either phase, when solvent evaporates, or when condensation occurs. In those cases, total, inert, and component balances should be solved together.
Confusing equilibrium with operating performance
An equilibrium curve does not represent the actual concentration profile in a finite pilot column. It represents the limiting relationship at equilibrium.
Actual performance also depends on packing, interfacial area, mass-transfer coefficients, liquid distribution, gas maldistribution, flooding, temperature variation, and residence time.
Ignoring chemical reaction
The balances described here apply to physical absorption without reaction. If the solute reacts with the solvent, the component balance must include a reaction-generation or consumption term, and the equilibrium and mass-transfer behavior may change substantially.
How to Apply This to Your Pilot Plant
Begin with a clearly defined basis, consistent composition units, measured inlet conditions, and a complete set of outlet measurements where possible.
- If your primary focus is outlet flow rates: Use the overall balance together with inert-component balances, especially when solute removal changes the total gas flow.
- If your primary focus is solute recovery: Apply the gas- and liquid-side component balances and calculate recovery from the difference between inlet and outlet solute rates.
- If your primary focus is solvent optimization: Construct the operating line for different (L/G) ratios and compare each case with the equilibrium relationship.
- If your primary focus is column design: Use stagewise balances for ideal stages or integrate differential balances with mass-transfer correlations for packed-column behavior.
- If your primary focus is model validation: Compare predicted and measured outlet compositions, check total and component balance closure, and investigate any mismatch before adjusting model parameters.
A disciplined combination of total, inert, and solute balances turns counter-current pilot-plant measurements into a defensible model of gas recovery performance.
Summary Table:
| Model element | Purpose | Key relationship |
|---|---|---|
| Overall balance | Accounts for total material entering and leaving | G_in + L_in = G_out + L_out |
| Solute balance | Calculates component transfer and recovery | Inlet solute rate = outlet gas solute rate + outlet liquid solute rate |
| Inert balance | Determines changing gas flow when solute is absorbed | G_in y_I,in = G_out y_I,out |
| Operating line | Describes the material-balance path through the column | Commonly related to L/G |
| Equilibrium curve | Defines the gas-liquid compositions at equilibrium | y_A* = f(x_A) |
| Column model | Predicts stage requirements or packing height | Stagewise or differential mass-transfer balances |
| Validation data | Checks model accuracy and operating reliability | Flow, composition, temperature, pressure, and balance closure |
Model Your Gas Absorption Process with LABPARK
Need reliable data for counter-current gas recovery, solvent optimization, or absorber design? Contact LABPARK to discuss an Educational and Vocational Unit Operations Pilot Plant tailored to your application.
LABPARK supports universities, research institutes, and enterprises with pilot plants for chemical engineering, bioprocess and biotech, and environmental and water treatment applications. Our systems help you:
- Demonstrate total, inert, and solute mass balances with measurable inlet and outlet streams.
- Evaluate gas absorption, recovery efficiency, solvent demand, and different
L/Gratios. - Compare operating lines with equilibrium data and investigate mass-transfer performance.
- Train students and operators using practical, configurable pilot-scale equipment.
- Generate dependable experimental data for process development, scale-up, and model validation.
Discuss your pilot-plant requirements with LABPARK and identify the right configuration for your target gas, solvent, column type, and educational or industrial objectives.
Related Products
- Dual-Mode Gas Absorption and Desorption Unit Operations Training Pilot Plant
- Carbon Dioxide Absorption and Desorption Educational Pilot Plant for Carbon Capture Studies
- Carbon Dioxide Adsorption and Capture Educational Unit Operations Pilot Plant
- Absorption and Desorption Educational Unit Operations Pilot Plant
- Packed Bed Absorption Educational Unit Operations Pilot Plant
People Also Ask
- How do temperature and pressure affect gas absorption and desorption? Optimize Pilot Plant Performance
- How do two-film & penetration theories apply to gas absorption pilot plant teaching? Key pedagogical insights.
- How does partial pressure behavior influence gas absorption pilot plants? Master Mass Transfer
- How is the direction and driving force of mass transfer determined in a gas absorption unit operations pilot plant?
- How to model chemical absorption as physical absorption? The pilot plant simplification criterion.