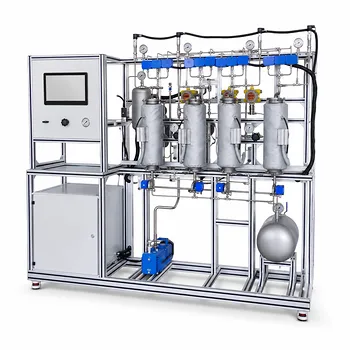
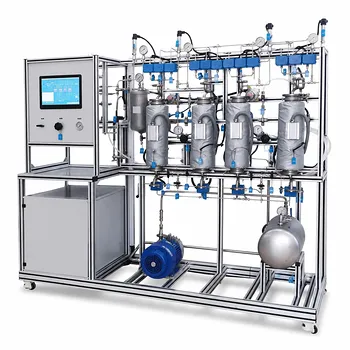
The breakthrough curve isn’t just a plot—it’s the heartbeat of your adsorption column. In a pilot plant used for chemical engineering education, the shape of that curve and the exact breakthrough point (typically when the outlet concentration reaches 5–10% of the inlet) are dictated by four interacting levers: the intrinsic properties of your adsorbent–adsorbate pair, the operating conditions you choose, the fluid velocity through the bed, and the mechanical setup of the packed bed itself.
The breakthrough curve is a fingerprint of mass transfer dynamics. The steepness of the curve tells you how efficiently the bed is being used, while the time to breakthrough reveals how long you can operate before regeneration. Mastering the four operational levers—adsorbent/adsorbate chemistry, temperature/pressure/concentration, flow rate, and particle size/bed packing—gives you direct control over both, turning pilot-plant data into a predictive design tool.
The Anatomy of a Breakthrough Curve
An adsorption column doesn’t instantly fail—it dies gradually. A mass transfer zone (MTZ) travels through the bed, and the breakthrough curve is the outlet concentration rising as that zone exits.
A steep curve means a short MTZ and high bed utilization. A broad, gradual curve signals a long MTZ, where much of the bed was unused before solute began to leak.
Why the Breakthrough Point Is a Design Choice
The 5–10% threshold is an operational standard, not a fixed law. In education, it’s an ideal teaching moment: the value you pick directly reflects safety margins, downstream sensitivity, or regeneration cost. A lower threshold protects product purity; a higher threshold squeezes more capacity from the bed.
The Four Lever Categories That Shape the Curve
All the knobs you can turn in the pilot plant fall into one of four categories. Each pulls the breakthrough curve in predictable ways.
1. Intrinsic Adsorbent–Adsorbate Properties
These are the non-negotiables—the chemistry you bring to the lab.
Adsorbent factors: Surface area, pore size distribution, and surface chemistry dictate capacity and adsorption kinetics. A high-capacity material delays breakthrough but may produce a broader curve if pores are tortuous.
Adsorbate factors: Molecular size, polarity, and charge determine affinity. Stronger affinity leads to a steeper curve and a later breakthrough point because the solute is more effectively captured in the MTZ.
2. Operating Conditions: Temperature, Pressure, Concentration, pH
These variables shift the adsorption equilibrium and kinetics.
Temperature: Adsorption is usually exothermic. Raising temperature reduces adsorbent capacity, causing earlier breakthrough and potentially flattening the curve as the MTZ lengthens. For physical adsorption, this is pronounced; for chemisorption, it may be negligible.
Pressure (gas-phase systems): Higher partial pressure of the adsorbate increases driving force and capacity. This can sharpen the curve but often pushes the breakthrough point later because the bed can hold more solute before saturation.
Feed concentration: A higher inlet concentration loads the bed faster. The breakthrough point arrives sooner, but the curve itself may remain steep if the MTZ is unaffected. In some cases, higher concentration shortens the MTZ (due to increased driving force), sharpening the curve.
pH (liquid-phase systems): pH changes the ionization of adsorbate and surface charge of the adsorbent. A pH that maximizes electrostatic attraction steepens the curve and delays breakthrough; an unfavorable pH weakens the interaction and spreads the curve.
3. Fluid Dynamics: Flow Velocity Matters
The velocity of the mobile phase is the most common dial students (and operators) turn.
At low flow rates: The MTZ is short relative to the bed length. The breakthrough curve is steep, and the column is used efficiently. But the residence time is long, so the breakthrough point (in clock time) arrives late.
At high flow rates: The MTZ stretches because there is less time for the solute to diffuse into pores. The curve broadens, and breakthrough occurs earlier in time, even though the solute front physically moves faster through the bed. This directly reduces usable bed capacity.
4. Mechanical Factors: Particle Size and Bed Packing
How you build the bed determines the quality of contact.
Particle size: Smaller particles reduce intraparticle diffusion resistance, shortening the MTZ and steepening the curve. The downside is higher pressure drop, which can limit the flow rates you can use. Larger particles give a gentler, more forgiving curve but sacrifice sharpness.
Bed packing density: Uniform, dense packing minimizes channeling and dead zones. A well-packed bed produces a symmetric, steep curve. Poor packing—voids, uneven settling—causes early leakage and a long, tailing curve. In educational settings, this is a classic mistake that generates valuable discussion.
Understanding the Trade-offs
No single configuration is perfect. Every advantage carries a cost, and recognizing these trade-offs is where chemical intuition grows.
Steep curve vs. early detection: A very steep curve is excellent for bed utilization but gives operators almost no warning before breakthrough. An overly broad curve is forgiving but wastes a large fraction of the bed.
High flow rate efficiency vs. capacity: Fast flow rates suit throughput-focused processes but lead to earlier breakthrough and lower effective capacity. Slower rates maximize capacity but reduce the amount of fluid treated per hour.
Small particles vs. pressure drop: Fine adsorbents give superior mass transfer but may demand prohibitively high energy for the feed pump or compressor. In a teaching plant, this often forces a compromise between data quality and equipment limitations.
The 5–10% trap: Students often treat the threshold as absolute. In practice, a 5% breakthrough may be driven by a minor channel, not genuine saturation. Cross-checking with a pressure drop trend or a second detection point can prevent misinterpretation.
Making the Right Choice for Your Educational Goal
In a teaching environment, you can deliberately exaggerate these effects to drive home fundamental concepts. Here’s how to align your pilot-plant settings with your learning objectives:
- If your primary focus is to demonstrate mass transfer zone dynamics: Vary the flow velocity across three runs while keeping all else constant. Students will directly observe how a faster flow stretches the MTZ and moves the breakthrough point left.
- If your primary focus is to explore adsorption isotherms and capacity: Manipulate feed concentration or temperature. Comparing breakthrough times at different concentrations reveals the shape of the isotherm without a separate equilibrium experiment.
- If your primary focus is to teach the impact of bed integrity: Deliberately pack one column loosely and one with vibration-induced tight packing. The difference in curve shape and the appearance of early leakage showcases why industrial columns are engineered for uniform distribution.
- If your primary focus is on scale-up methodology: Keep the same adsorbent particle size but compare columns of different diameters. The breakthrough curve should remain similar if the velocity and bed height are constant—an elegant proof of dimensional analysis.
A well-run adsorption pilot plant turns abstract mass transfer equations into a tangible, visual story. Master these operational levers, and you’ll not only predict when your bed will need regeneration—you’ll understand exactly why.
Summary Table:
| Lever Category | Key Variables | Impact on Breakthrough Curve & Point |
|---|---|---|
| 1. Chemistry | Adsorbent surface area, adsorbate affinity | Stronger affinity delays breakthrough and steepens the curve. |
| 2. Operations | Temperature, pressure, concentration, pH | Higher temperatures and feed concentrations lead to earlier breakthrough. |
| 3. Fluid Dynamics | Mobile phase flow velocity | High flow rates stretch the mass transfer zone, causing earlier breakthrough. |
| 4. Mechanicals | Particle size, packing density | Smaller particles and uniform packing yield steeper curves and better efficiency. |
Empower Your Students and Researchers with LABPARK
To truly master mass transfer dynamics, students need hands-on experience with real-world equipment. LABPARK provides state-of-the-art Educational and Vocational Unit Operations Pilot Plants in chemical engineering, bioprocess & biotech, and environmental & water treatment for universities, research institutes, and enterprises.
Our pilot plants—including adsorption columns—are designed for safe, durable, and highly visual operation, helping your institution bridge the gap between academic theory and industrial practice.
Ready to upgrade your lab? Contact LABPARK today to discuss your laboratory requirements and request a quote!
Related Products
- Carbon Dioxide Adsorption and Capture Educational Unit Operations Pilot Plant
- Educational Pressure Swing Adsorption Ethylene Capture Unit Operations Pilot Plant
- Absorption and Desorption Educational Unit Operations Pilot Plant
- Multi-Component Gas Pressure Swing Adsorption Pilot Plant for Unit Operations Education
- Pressure Swing Adsorption Educational Unit Operations Pilot Plant
People Also Ask
- How does operating pressure influence the transition between absorption and desorption in a CO2 pilot plant?
- How do physical vs chemical adsorption impact pilot plant design? Key operational & regeneration strategies.
- How is moisture removal managed in an adsorption unit operations pilot plant? Dew Point Control Guide
- What are the key differences between PSA and TSA? Choosing the Right Adsorption Pilot Plant
- What unit operations are critical for CCUS training pilot plants? Build hands-on engineering expertise.