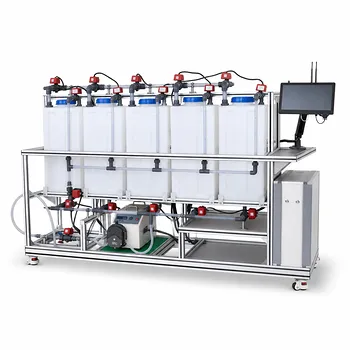
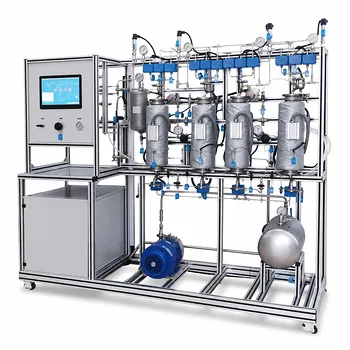
The recommended approach is at-line spectrophotometry with color space analysis. The most effective method for monitoring dye degradation and discoloration kinetics in environmental water treatment pilot plants is to recirculate liquid between the photochemical reactor and an at-line spectrophotometer fitted with a quartz flow cell. By continuously measuring absorbance and calculating the discoloration yield in the CIE L*a*b* color space, operators can track degradation kinetics and non‑destructively pinpoint the exact moment the treatment is complete. This real‑time feedback eliminates manual sampling and ensures process consistency.
For pilot-scale dye degradation studies, at‑line spectrophotometric monitoring using CIE L*a*b* analysis provides a non‑destructive, real‑time window into discoloration kinetics. It transforms a complex photochemical process into a quantifiable and controllable operation, enabling precise endpoint detection without disrupting the treatment run.
Why At‑Line Spectrophotometry Is the Optimal Choice
Capturing Kinetics in Real Time
The recirculation loop between the reactor and a spectrophotometer enables continuous, automated measurement. Unlike grab sampling, this approach captures the dynamic color changes that occur as azo dyes and other organic pollutants degrade under UV or visible light.
At‑line monitoring means the sample is diverted from the main process stream, measured, and returned—without wasting product or interrupting the reaction. This closed loop ensures that the data reflect the actual reactor conditions at every moment.
The Power of Color Space Analysis
Measuring simple absorbance at a single wavelength can be misleading when multiple degradation intermediates form. The CIE L*a*b* system quantifies the perceived color with three values: L* (lightness), a* (green‑red), and b* (blue‑yellow).
By tracking the total color difference (ΔE) between the treated sample and a reference (often pure water), you obtain a single, intuitive metric that correlates directly with visible discoloration. This removes ambiguity and allows you to compare runs objectively.
Non‑Destructive Monitoring with a Recirculation Loop
A quartz flow cell is transparent to UV and visible light, so the measurement itself does not alter the sample. The liquid can be returned to the reactor unchanged, preserving the very kinetics you are trying to observe.
This non‑destructive nature is critical for small‑volume pilot plants, where every milliliter counts. It also enables long‑term, unattended monitoring without the risk of contaminating the reactor with sampling tools.
Implementing the Method in a Pilot Plant
Integrating the Quartz Flow Cell
Install the flow cell in a bypass line equipped with a small peristaltic pump. The cell must have high UV transmittance and be free of air bubbles, as they scatter light and produce noisy data.
Use short, inert tubing (e.g., PTFE) to minimize dead volume and prevent dye adsorption. A well‑designed bypass guarantees that the measured color reflects the reactor’s state with only a few seconds of lag.
Calculating Discoloration Yield in CIE L*a*b*
Set the spectrophotometer to acquire a full visible spectrum. The instrument’s software then converts the spectrum into L*, a*, and b* coordinates under a standard illuminant (typically D65).
Define the reference as the blank solution (e.g., distilled water) and record its L*₀, a*₀, b*₀ values. During the treatment run, compute the discoloration yield from the evolution of the color difference ΔE = √[(ΔL*)² + (Δa*)² + (Δb*)²]. A declining ΔE curve indicates progressive dye breakdown.
Pinpointing the Endpoint
The treatment is complete when the CIE L*a*b* values stabilise—i.e., when ΔE no longer changes significantly between consecutive readings. This criterion is far more robust than a fixed absorbance threshold, because it automatically accounts for slow‑reacting residual chromophores.
Operators can set an automatic alarm or shut‑off when the ΔE change falls below, for example, 0.1 units per minute. This eliminates guesswork and prevents energy‑wasting over‑treatment.
Understanding the Trade‑offs and Practical Limitations
When Spectrophotometry Alone Isn’t Enough
Color removal does not always equal complete mineralization. UV‑Vis spectroscopy only detects chromophoric compounds. If you need to confirm the destruction of all organic carbon, you must combine the spectrophotometer with a TOC or DOC analyzer.
Turbid samples scatter light and distort the color coordinates. In such cases, filtration or a side‑stream clarifier may be required upstream of the flow cell to maintain data integrity.
Maintenance and Calibration Demands
Flow‑cell fouling by sticky dye intermediates can reduce optical throughput and cause baseline drift. Regular cleaning with warm soapy water (for organic stains) or dilute citric acid (for inorganic deposits) is essential. Avoid abrasive scrubbing, especially if the cell windows are delicate quartz.
Periodic zero‑point checks with a blank solution ensure that the instrument’s response remains accurate over long campaigns. While CIE L*a*b* measurements are less calibration‑intensive than conductivity sensors, the spectrophotometer’s wavelength accuracy should still be verified with a holmium oxide filter at least once per year.
Making the Right Choice for Your Monitoring Goal
The best monitoring setup depends on what you need to learn from your pilot plant. Use the following guide to align your choices with your objectives.
- If your primary focus is tracking discoloration kinetics: Rely on the at‑line spectrophotometer with CIE L*a*b* analysis to capture real‑time color evolution without disturbing the reactor.
- If your main goal is to determine the exact completion point of a treatment run: Monitor the ΔE curve and stop the process when the color difference stabilizes, ensuring no energy is wasted on over‑treatment.
- If you require a broader water quality assessment beyond color: Complement the spectrophotometer with online TOC/DOC sensors or conductivity meters for a more holistic picture of pollutant degradation.
- If instrument maintenance is a concern: Implement a regular cleaning protocol for the quartz flow cell and run frequent blank checks to preserve the accuracy of your discoloration data.
By matching the monitoring method to your specific need, you turn dye degradation from an uncertain batch operation into a predictable, science‑driven process.
Summary Table:
| Feature | Details for Dye Degradation Monitoring |
|---|---|
| Recommended Method | At-line spectrophotometry with CIE L*a*b* color space analysis |
| Hardware Setup | Recirculation loop with a quartz flow cell and peristaltic pump |
| Key Metric | Total color difference (ΔE) evolution over time |
| Main Advantage | Real-time, non-destructive kinetics tracking & precise endpoint detection |
| Limitation | Only monitors color removal; requires TOC/DOC for mineralization analysis |
Scale Up Your Water Treatment Research with LABPARK
Are you looking to optimize dye degradation studies or scale up environmental water treatment processes? LABPARK provides state-of-the-art Educational and Vocational Unit Operations Pilot Plants tailored for chemical engineering, bioprocess & biotech, and environmental & water treatment.
Designed specifically for universities, research institutes, and enterprises, our pilot plants ensure precise process control, reliable data collection, and robust hands-on research capabilities.
Ready to elevate your laboratory's capabilities? Contact LABPARK today to discuss your pilot plant requirements and get a custom engineering solution!
Related Products
- Photocatalytic Membrane Separation and Degradation Unit Operations Pilot Plant
- Electrochemical Water Treatment Educational Unit Operations Pilot Plant
- Thermal Desorption Exhaust Gas and Tail Water Treatment Educational Pilot Plant
- Dual-Mode Rectification Pilot Plant for Practical Training Unit Operations
- Continuous Batch Extractive Distillation Educational Pilot Plant
People Also Ask
- What are the key differences in membrane configurations? Choose the Right Unit Operations Pilot Plant
- How do polymer membranes restrict gas separation? Key pilot plant limits.
- How do temperature and pH affect membrane conductivity? Pilot Plant Guide
- How Do Pervaporation, Vapor, and Gas Permeation Differ in Pilot Plants? Key Comparison
- How do membrane separation pilot plants teach RO limits? Master osmotic pressure dynamics.