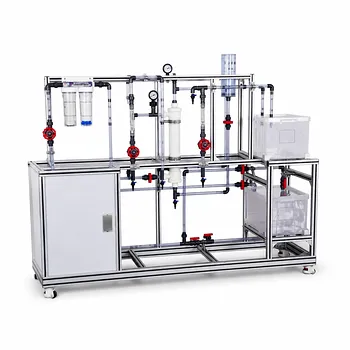
The most profound lesson a pilot-scale reverse osmosis system teaches is not how to make water, but how to measure the invisible force resisting that process. Membrane separation pilot plants use osmotic pressure as a theoretical energy floor. By calculating the osmotic pressure from the feed’s salt concentration and then measuring the actual operating pressure needed to achieve a target recovery, operators directly quantify the excess energy demanded by membrane resistance, concentration polarization, and fouling. This turns an abstract thermodynamic limit into a set of tangible, measurable performance gaps that define the real-world economic and technical boundaries of reverse osmosis desalination.
Pilot plants transform osmotic pressure from a textbook equation into a diagnostic tool. The gap between the calculated osmotic pressure and the system’s applied pressure reveals the true energy cost of practical RO, and illustrates why recovery rate, fouling control, and membrane selection are the central levers—not afterthoughts—of economic viability.
The Theory You Build On: Osmotic Pressure as the Energy Threshold
A Colligative Property with Engineering Consequences
Osmotic pressure is a colligative property directly tied to the concentration of dissolved solutes. To recover fresh water from a saline feed, the applied pressure must exceed this natural osmotic pressure to reverse the solvent flow. In a pilot plant, this threshold becomes the minimum energy input required before a single drop of permeate is produced.
The Baseline Calculation: How Pilot Plants Establish a Reference Point
Trainees and engineers first calculate the theoretical osmotic pressure of the feed solution—typically using an NaCl concentration and a van’t Hoff-type relation. The pilot plant then forces a comparison: if the theoretical pressure was ( X ) bar, why does the system gauge read ( X + Y ) bar? That simple gap is where every practical limitation lives.
Learning by Measuring: How the Pilot Plant Exposes Real-World Limitations
The Applied Pressure Always Exceeds Osmotic Pressure
A membrane’s water flux follows the relationship
( \frac{dV}{dt} = \frac{A}{h}L_p(\sigma\Delta\pi - \Delta P) ).
To get any forward flow, ( \Delta P ) must not only surpass ( \sigma\Delta\pi ) but also overcome the membrane’s hydraulic resistance. Pilot plants make this visible: the operator sees that feed pressure must climb well above the theoretical osmotic value simply to maintain a practical permeate flow.
The Hidden Energy Thieves: Polarization and Membrane Resistance
Concentration polarization builds a stagnant, highly concentrated layer right at the membrane surface. This local osmotic pressure can be significantly higher than the bulk feed’s value, silently demanding a higher applied pressure. On top of that, membrane fouling adds its own resistance term. The pilot plant lets users vary cross-flow velocity and track how the required pressure shifts—teaching, for instance, that raising velocity reduces polarization but increases pump energy in a near-zero-sum trade.
The Recovery Rate Feedback Loop
As the recovery rate increases, the concentrate stream becomes saltier, and its osmotic pressure rises non-linearly. A pilot plant illustrates this starkly: pushing recovery from 40% to 60% can cause the required feed pressure—and thus the specific energy consumption—to spike. That sharp bend in the curve is the practical limit that defines how far a single stage can be economically pushed.
Understanding the Trade-offs and Operational Limits
Energy Efficiency vs. Recovery
Unlike distillation, RO avoids the enormous latent heat penalty of a phase change, making it fundamentally energy-efficient. However, the pilot plant teaches that this efficiency is not free: higher recovery cuts brine volume but steeply increases the energy needed per cubic meter of permeate. The lesson is that an economic optimum exists, not a simple technical maximum.
Membrane Stability and System Cost
Very high operating pressures demand membranes with exceptional structural stability and pressure-resistant housings, which are more expensive. Pilot-scale runs reveal that pushing pressure too far can also induce membrane compaction, reducing permeability over time. The plant thus connects osmotic pressure limits directly to capital and maintenance realities.
Concentration Polarization: A Manageable but Unavoidable Burden
The fight against polarization is a study in diminishing returns. Increasing cross-flow velocity lowers the polarization-induced osmotic pressure spike, but at the cost of higher pumping energy. Neglecting it raises the effective osmotic pressure and accelerates fouling. The pilot plant quantifies both sides, showing that a balanced, intermediate operating point is the only sustainable path.
Making the Right Choice for Your Desalination Project
- If your primary focus is minimizing energy consumption: Use the pilot plant to identify the lowest practical operating pressure that still meets permeate quality targets. This often means accepting a lower recovery rate to keep the concentrate osmotic pressure—and thus the total energy demand—within a tight band.
- If your primary focus is maximizing water recovery: Map the sharp increase in required feed pressure at high recoveries, and let the data tell you when adding a second stage or an interstage booster pump becomes cheaper than forcing a single stage to an extreme osmotic limit.
- If your primary focus is long-term operational reliability: Monitor how the gap between theoretical and actual pressure widens over time. That differential becomes a real-time fouling indicator, directly informing cleaning cycles and pretreatment upgrades.
- If your primary focus is education or process scale-up: Treat the pressure gap as your scaling metric. The deviation from ideal osmotic theory is a concentrated form of all non-idealities—polarization, fouling, hydraulic losses—and it will only amplify at full plant scale.
By letting the membrane speak through the pressure gauge, a pilot plant makes the invisible force of osmotic pressure a tangible, measurable reality—and in doing so, equips you to build desalination processes that are both physically possible and economically sensible.
Summary Table:
| Key Factor | Physical Impact | Engineering Lesson / Trade-off |
|---|---|---|
| Applied vs. Osmotic Pressure | Excess pressure is required to overcome membrane hydraulic resistance. | Theoretical osmotic pressure is the absolute minimum energy threshold. |
| Concentration Polarization | Solute buildup at the membrane surface increases localized osmotic pressure. | Increasing cross-flow velocity reduces polarization but increases pump energy. |
| Recovery Rate | Salinity of concentrate rises, spiking osmotic pressure. | Higher recovery rates cut brine waste but exponentially increase energy demand. |
| Membrane Fouling | Deposited foulants add structural resistance to water flux. | Operational pressure gaps serve as real-time diagnostics for cleaning cycles. |
Bring Hands-On Desalination Training to Your Institution
Bridge the gap between thermodynamic theory and real-world engineering. LABPARK designs and manufactures high-performance Educational and Vocational Unit Operations Pilot Plants in chemical engineering, bioprocess & biotech, and environmental & water treatment.
We help universities, research institutes, and enterprises equip their laboratories with robust systems that demonstrate osmotic pressure, membrane fouling, and energy optimization in real-time.
Contact LABPARK today to discuss your laboratory requirements and get a customized technical proposal!
Related Products
- Multi-Functional Membrane Separation Educational Pilot Plant for Unit Operations Lab
- Photocatalytic Membrane Separation and Degradation Unit Operations Pilot Plant
- Multifunctional Membrane Separation Educational Pilot Plant with Ultrafiltration, Nanofiltration, Reverse Osmosis
- Ultrafiltration Membrane Separation Educational Pilot Plant
- Hollow Fiber Ultrafiltration Membrane Separation Educational Pilot Plant
People Also Ask
- What are the key differences in membrane configurations? Choose the Right Unit Operations Pilot Plant
- How Do Pervaporation, Vapor, and Gas Permeation Differ in Pilot Plants? Key Comparison
- How do temperature and pH affect membrane conductivity? Pilot Plant Guide
- How do polymer membranes restrict gas separation? Key pilot plant limits.
- What are the advantages of membrane separation pilot plants? Energy-saving process intensification.