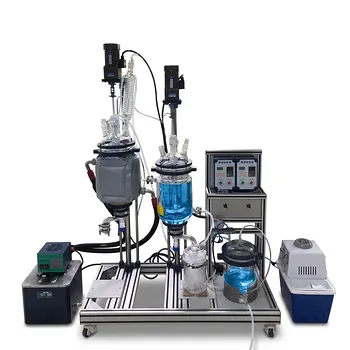
The short answer is that students can use educational pilot plants to move beyond simple product recovery and instead conduct quantitative engineering analyses. They measure cake growth, calculate specific cake resistance, and determine filter medium resistance, but the most instructive data comes from studying the washing step's kinetics to optimize solvent use and purity.
The core insight is that pilot-scale filtration is not a simple sieve—it’s a study of dynamic resistances. While the synthesis defines the product, the solid-liquid separation step defines its purity, yield, and economic viability. The key learning opportunity lies in quantifying how a compressible cake of green coordination crystals resists flow and how a wash solvent displaces trapped impurities, directly linking lab observations to industrial scale-up calculations.
Quantifying Cake Build-Up and Flow Resistance
The most fundamental data students can gather revolves around the growing filter cake, which is the primary source of resistance during separation. The pilot plant provides the controlled environment needed to capture this.
Plotting Filtration Rate Curves
Students can operate a plate-and-frame or vacuum drum filter to collect filtrate volume over time under either constant pressure or constant flow. By tracking how the flow rate decays as the cake builds, they can directly plot the characteristic filtration curve, a foundational concept in chemical engineering.
Calculating Specific Cake Resistance (α) and Medium Resistance (Rm)
Using the slope and intercept from a plot of t/V versus V, students can back-calculate the specific cake resistance. This parameter quantifies how easily fluid passes through the crystal mass. They also isolate the filter medium resistance, learning to distinguish between the resistance caused by their cake and the baseline resistance of the cloth or mesh itself.
Mapping the Washing Step Kinetics
Washing the potassium tris(oxalato)ferrate(III) trihydrate cake is not just a rinsing step; it is a displacement process ripe for kinetic analysis. This is where purity and yield are balanced.
Measuring Impurity Displacement Efficiency
By collecting discrete wash effluent samples over time, students can measure the concentration of residual reactants (like oxalate ions) in each fraction. They can then generate a wash curve showing how impurity concentration drops relative to the volume of wash solvent used, providing a direct visual of diminishing returns.
Optimizing Wash Solvent Ratios
A critical experimental goal is determining the minimum amount of ethanol or acetone required to achieve a target purity. Students can correlate the volume of wash solvent with final crystal purity and drying time. This directly teaches the economic trade-off between solvent consumption, waste handling, and product specification.
Analyzing the Effect of Operational Parameters
The pilot plant allows students to manipulate key variables and observe their non-linear effects on separation performance. This is essential preparation for troubleshooting real industrial processes.
Investigating Compressibility with Pressure Drops
This is a critical learning moment. An increase in pressure drop (ΔP) in a lab Buchner funnel seems to linearly speed things up, but in the pilot plant, higher ΔP often compresses a deformable cake. Students can measure how the specific cake resistance (α) increases with pressure, proving that a higher driving force can paradoxically collapse the cake’s pore structure and drastically slow the process.
Evaluating Filter Media and Cake Clarity
The pilot plant setup enables a standardized test of different media types against the same synthesized slurry. Students can assess how a finer retention rating improves filtrate clarity but might cause blinding and reduce flux. They connect the media’s micron rating directly to the quality of the solid product and the filtrate’s turbidity.
Understanding the Trade-offs
No operational decision in solid-liquid separation is free from consequence. A common pitfall is optimizing for one metric, like speed, at the expense of another, like wash efficiency. Recognizing these trade-offs is what separates theoretical understanding from practical competence.
Filtration Speed vs. Cake Purity
A fast, thick cake may capture all solids quickly but will likely channel during washing. Students must grapple with the fact that a slightly slower filtration, forming a uniform cake, often results in more efficient impurity displacement and a lower overall solvent requirement, saving time and cost in subsequent drying steps.
Pressure vs. Cake Structure
The temptation to crank up the pressure to increase throughput is often counterproductive. As demonstrated with compressible cakes, higher pressure can collapse particle bridges, leading to a densely packed, low-permeability cake. Students learn that identifying the critical pressure point—beyond which flux plateaus or even declines—is a core scale-up task.
Plug Flow vs. Perfect Mixing in Washing
Students can analyze whether the wash liquor is displacing the mother liquor as a plug or mixing with it. A plug flow wash is drastically more efficient, requiring less solvent. Observing a long tail of impurity concentration in the effluent teaches them that channelling or back-mixing is occurring in their cake, a direct diagnostic of cake structure integrity.
Making the Right Choice for Your Analysis Goals
Your specific educational objective will dictate which operational parameters and measurements you should prioritize on the pilot plant. The setup, whether a plate-and-frame press or a vacuum drum filter, provides the raw data; it’s the analysis that creates the value.
- If your primary focus is fundamental process design: Calculate the specific cake resistance and medium resistance at multiple pressures. Use this data to derive the compressibility index of your synthesized compound.
- If your primary focus is purity and downstream efficiency: Build a complete mass balance around the washing cycle. Measure impurity concentrations in the effluent to plot the wash curve and definitively determine the optimal wash ratio without over-drying or diluting the product.
- If your primary focus is equipment selection and troubleshooting: Vary the filter media and document the impact on filtrate clarity and flux. Directly compare the performance of a vacuum drum filter's continuous operation against the batch profile of a plate-and-frame press.
The pilot plant transforms the simple recovery of green crystals into a rigorous investigation of fluid mechanics, where every logged data point connects a chemical synthesis to the industrial reality of scalable, economic production.
Summary Table:
| Analysis Category | Key Parameters Measured | Educational & Practical Value |
|---|---|---|
| Cake Build-Up | Specific cake resistance ($\alpha$) & medium resistance ($R_m$) | Quantifies flow resistance and guides filter media selection. |
| Washing Kinetics | Impurity concentration vs. wash solvent volume | Optimizes solvent consumption to balance yield and purity. |
| Operational Parameters | Compressibility index via pressure drop ($\Delta P$) | Teaches scale-up challenges and how to prevent cake collapse. |
Bring Industrial-Scale Engineering to Your Lab
Ready to elevate your training programs and research? LABPARK provides premium Educational and Vocational Unit Operations Pilot Plants specializing in chemical engineering, bioprocess & biotech, and environmental & water treatment.
We help universities, research institutes, and enterprises bridge the gap between laboratory synthesis and industrial-scale operation with robust, data-rich training systems.
Contact LABPARK today to request a catalog or discuss your custom lab requirements!
Related Products
- Hot Filtration Educational Unit Operations Pilot Plant Laboratory System
- Gas-Solid Heterogeneous Separation Demonstration Educational Unit Operations Pilot Plant
- Pressure Swing Adsorption Educational Unit Operations Pilot Plant
- Gallium and Indium Selective Extraction Educational Pilot Plant
- Comprehensive Liquid-Liquid Extraction Pilot Plant for Engineering Education
People Also Ask
- How to Determine Specific Cake (r) & Filter Medium (Rm) Resistance Using Filtration Pilot Plant Data
- How can researchers identify and resolve filter medium blinding? Optimize Your Pilot Plant Runs
- How to select solid-liquid separation equipment for pilot plants? A Step-by-Step Guide
- Why Demo Constant-Rate to Constant-Pressure Filtration on a Pilot Plant? Key Practical Insights
- Why Analyze Filtration Flux & Cake Compressibility in Pilot Plants? Master Solid-Liquid Separation