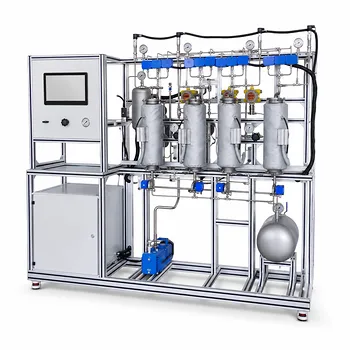
The fundamental performance of a bubble column pilot plant hinges on four directly measurable parameters: gas holdup, pressure drop, bubble size distribution, and the volumetric mass transfer coefficient (kLa). These are the practical, operational metrics that quantify interfacial area, flow resistance, and overall absorption rate. Together, they form the empirical backbone for understanding how bubble column geometry, sparger design, and liquid properties translate into real-world gas absorption efficiency.
While gas holdup, pressure drop, bubble size distribution, and kLa are the immediate engineering metrics you monitor, the deeper goal is using these numbers to validate the driving force for mass transfer and to predict behavior at production scale. Without a clear link from pilot readings to equilibrium deviation and scale-up rules, the data remains just numbers.
The Cornerstone Metrics in a Bubble Column
These four parameters define the real-time performance snapshot of any bubble column pilot unit. They are what you measure directly to diagnose problems, compare designs, and build predictive models.
Gas Holdup: The Foundation of Interfacial Area
Gas holdup is the volume fraction of the column occupied by gas bubbles. It directly dictates the available surface area for gas-liquid contact, making it the single most influential factor for mass transfer capacity. A higher gas holdup, up to the onset of slug flow, generally means more interfacial area and faster absorption.
The value is not static. It rises with increasing superficial gas velocity but is also highly sensitive to sparger design, liquid viscosity, and any surfactants present. In pilot training, measuring holdup by bed expansion or differential pressure is often the first step in mapping the column’s operating window.
Pressure Drop: The Energetic Fingerprint
Monitoring pressure drop across the column provides more than just a friction factor. It serves as a clear indicator of flow regime transitions. A linear increase in pressure drop with gas flow suggests homogeneous bubbly flow, while a plateau or sudden change often signals the shift to a churn-turbulent regime where column-scale circulation patterns take over.
From an operational perspective, pressure drop analysis allows you to balance mass transfer efficiency against energy consumption. The sparger’s resistance and the hydrostatic head of the liquid both contribute, making this a critical metric for evaluating the long-term cost of blower or compressor power.
Bubble Size Distribution: The Micro-Scale Architecture
A single mean bubble diameter is insufficient. The entire bubble size distribution controls the specific interfacial area and the degree of gas-phase backmixing. Small, uniform bubbles provide enormous surface area for mass transfer, while large, fast-rising bubbles contribute more to gas throughput and liquid circulation.
Sparger pore size, surface tension, and coalescence behaviour in the liquid determine this distribution. In a pilot plant, observing bubble size (often via imaging or optical probes) teaches a fundamental lesson: the same volumetric gas flow can produce an order-of-magnitude different absorption performance depending on bubble sizes.
The Volumetric Mass Transfer Coefficient (kLa): The Ultimate Performance Metric
The volumetric mass transfer coefficient (kLa) fuses the liquid-side mass transfer coefficient (kL) and the specific interfacial area (a) into a single, actionable number. It is the effective rate constant for gas dissolution into the liquid phase. In virtually all bubble column pilot evaluations, kLa is the headline efficiency number.
Measuring dissolved oxygen or CO₂ profiles over time at various gas flow rates allows direct calculation of kLa. This lets you quantify exactly how much faster absorption occurs when you change a sparger, add a static mixer, or alter temperature and viscosity. Critically, kLa is what you must predict to scale a reactor, making it the bridge between pilot data and commercial design.
Beyond the Surface: Driving Forces and Fluid Properties
Measuring bulk parameters answers "how fast," but understanding why requires looking at the thermodynamic and liquid-phase properties that set the stage for mass transfer.
Mass Transfer Driving Force
The actual rate of absorption is not determined by kLa alone; it is a product of kLa and the concentration driving force. This driving force is the deviation of the real system from equilibrium.
Absorption occurs only when the actual gas-phase concentration (y) is greater than the equilibrium gas-phase concentration (y*) for the current liquid loading, or equivalently, the liquid concentration (x) is less than its equilibrium value (x*). The larger this deviation, expressed as a partial pressure or concentration difference, the steeper the transfer gradient and the more efficient the column. If the driving force collapses due to liquid saturation, even the highest kLa becomes useless.
The Impact of Liquid Properties
Mass transfer coefficients are strongly tied to liquid-phase physical properties. Higher liquid viscosity reduces the diffusion coefficient and thickens the liquid film around bubbles, directly suppressing kL. Surface tension alters bubble coalescence and initial formation size, effectively reshaping the interfacial area term (a).
In pilot-scale work, doping the liquid with thickeners or surfactants while measuring kLa reveals these sensitivities. This is essential for bioprocessing, where fermentation broths are often non-Newtonian, and for environmental applications treating viscous waste streams. The Akita and Yoshida correlation, for example, explicitly ties kLa estimation to column diameter, gas velocity, liquid diffusion coefficient, viscosity, and surface tension, showing that ignoring these liquid properties makes scale-up predictions unreliable.
From Pilot Plant to Production: Scale-Up Considerations
A 100mm pilot column does not behave like a 2m industrial reactor. Key parameters change their relative importance with size, and failing to account for this is a classic scale-up failure mode.
Geometry and Flow Regimes
Column diameter and height-to-diameter ratio shift the flow map. Laboratory columns (e.g., 70–150 mm diameter) often operate with a height-to-diameter ratio of 3:10, while industrial units can be closer to 1:2. In larger, shallower vessels, lower superficial gas velocities can create uneven gas distribution, and the hydrostatic head affects gas compressibility and bubble size at the sparger.
Correlations for kLa, like the one from Akita and Yoshida, are typically validated for specific diameter ranges (0.15 < dc < 0.6 m). Extrapolating beyond these limits without pilot trials at an intermediate scale introduces significant risk. A change from bubbly flow on the bench to full churn-turbulent flow in the plant can invalidate a design’s assumed interfacial area.
Backmixing and Uniformity
In a well-mixed pilot column, gas-phase backmixing can be severe, causing gas that has already partially reacted to recirculate and dilute the driving force. This backmixing directly reduces overall reaction efficiency. In production reactors, especially mechanically agitated ones, controlling backmixing through baffles or targeted sparging becomes a primary design challenge.
Similarly, for gas-liquid-solid systems, the pilot plant must demonstrate that solid particles remain uniformly suspended. If solids settle in the pilot due to inadequate mixing, the scale-up design will face catastrophic solid handling problems. Observing concentration gradients in the pilot, not just the exit streams, is therefore a key evaluative step.
Understanding the Trade-offs
Pilot plant evaluation is rarely about maximizing a single parameter and often involves navigating conflicting requirements.
-
High Gas Holdup vs. Stable Operation: Pushing gas flow to maximize holdup and kLa can trigger slugging or flooding, causing violent pressure oscillations and reduced mass transfer efficiency. The pilot must define the stable operating window.
-
Small Bubbles vs. Phase Separation: Generating extremely fine bubbles yields massive surface area but makes downstream gas-liquid disengagement difficult, potentially causing foaming or liquid carry-over out of the column.
-
Simple Correlations vs. Real Fluids: Empirical kLa correlations are fast and useful but often fail when applied to coalescing systems or fluids with changing rheology. Relying on a correlation without pilot-scale validation with your actual liquid is a common and costly mistake.
-
kLa Emphasis vs. Driving Force Neglect: Students and engineers often fixate on maximizing kLa through hardware changes while ignoring the equally powerful lever of the concentration driving force. An efficient absorber with a low driving force is still a poor absorber.
How to Apply This to Your Pilot Plant Evaluation
The right focus depends entirely on your end goal for the pilot study. Prioritize the parameter that answers your specific scale-up or design question.
- If your primary focus is comparing sparger or internals designs: Prioritize gas holdup and bubble size distribution measurements at identical gas flow rates, as these directly reflect the quality of the interfacial area generated.
- If your primary focus is calculating the required reactor height or the absorber’s intrinsic efficiency: Center your analysis on the measured kLa and use it alongside equilibrium data to determine the true mass transfer driving force in your column.
- If your primary focus is energy optimization and system integration: Monitor pressure drop across the column and the gas distributor, as this translates directly to compressor power and operational cost for a given degree of absorption.
- If your primary focus is moving from a clean water test to a real process fluid: Measure kLa before and after changing liquid viscosity and surface tension properties, as this reveals how the process broth will fundamentally differ from your baseline pilot data.
Knowing exactly which parameter dominates for your specific pilot objective transforms the bubble column from a theoretical exercise into a decisive tool for process design.
Summary Table:
| Parameter | What It Measures | Impact on Performance & Scale-Up |
|---|---|---|
| Gas Holdup | Volume fraction of column occupied by gas | Direct indicator of available interfacial contact area. |
| Pressure Drop | Flow resistance across the column | Identifies flow regime transitions and compressor power costs. |
| Bubble Size | Size distribution of bubbles | Controls specific surface area and gas-phase backmixing. |
| kLa | Volumetric mass transfer coefficient | Represents the overall gas dissolution rate and reactor sizing. |
Optimize Your Engineering Lab with LABPARK
Bridge the gap between academic theory and industrial application. LABPARK provides premium Educational and Vocational Unit Operations Pilot Plants in chemical engineering, bioprocess & biotech, and environmental & water treatment designed specifically for universities, research institutes, and enterprises.
Our advanced pilot systems deliver the precise, reliable mass transfer and gas absorption data you need to master scale-up rules and optimize industrial processes.
Ready to elevate your department's training and research capabilities? Contact us today to request a quote or discuss a custom design!
Related Products
- Packed Bed Absorption Educational Unit Operations Pilot Plant
- Absorption and Desorption Educational Unit Operations Pilot Plant
- Bench Scale Dual Column Gas Separation and Capture Educational Pilot Plant
- Dual-Mode Gas Absorption and Desorption Unit Operations Training Pilot Plant
- Multi-Component Gas Pressure Swing Adsorption Pilot Plant for Unit Operations Education
People Also Ask
- How Do Flow Regimes Transition in Packed Bed Pilot Plants? Key Scale-up Insights
- How does reactant concentration determine absorption column control? Gas-film vs. dual-film.
- How is the packing height of an absorption column calculated? Master HTU & NTU Concepts
- How does static vs. operating holdup affect pilot plant calibration? Avoid Critical Scale-Up Errors
- Why is counter-current flow selected for gas absorption? Maximize Pilot Plant Efficiency