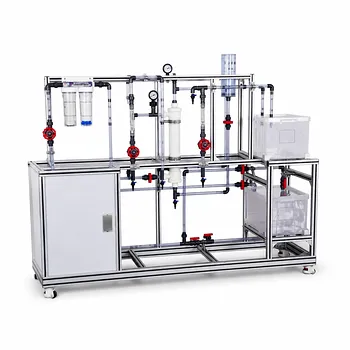
Pressure drives the permeate stream; feed concentration chokes it. In a membrane separation unit operations pilot plant for organic solvent nanofiltration (OSN), decreasing the operating pressure directly reduces both the permeate flux and the solute rejection. Simultaneously, a higher feed solute concentration lowers flux and rejection because it triggers concentration polarization and a corresponding rise in osmotic pressure at the membrane boundary layer. These two variables are the dominant levers governing the entire separation efficiency.
Balancing pressure and feed concentration in OSN is a classic fight between driving force and mass-transfer resistance. Pressure sets the potential for flux, but the real separation is defined by how well you manage the invisible wall of concentrated solute that forms at the membrane surface.
How Operating Pressure Controls Flux and Rejection
The Direct Link to Driving Force
OSN is a pressure-driven process modeled by the solution-diffusion mechanism. Permeate flux is proportional to the effective transmembrane pressure—the applied hydraulic pressure minus the osmotic pressure difference. Lower the operating pressure, and you shrink that net driving force, causing flux to fall. Rejection suffers in tandem because the reduced pressure allows more solute molecules to pass through the membrane, especially if the membrane’s selectivity is pressure‑dependent.
The High-Pressure Trap: Compaction and Polarization
Dialing up the pressure is not a free lunch. At industrially relevant pressures (above 20 bar), membrane compaction becomes a real risk. The porous support compresses and the free volume in the active layer shrinks, permanently increasing membrane resistance. While this increased resistance can make the boundary layer’s relative influence smaller, it also means your flux no longer rises linearly with pressure—and you may never recover the original permeability.
At very high pressures (e.g., 40 bar), severe concentration polarization can push the solute concentration at the membrane interface to more than twice the bulk concentration. This can approach the solute’s solubility limit and trigger gel-layer formation, which acts like a secondary membrane, crippling flux and potentially causing irreversible fouling. So while higher pressure theoretically increases flux, the practical ceiling is set by compaction and the explosive growth of concentration polarization.
The Missing Piece: Membrane Material Stability
The membrane itself must survive the operating pressure without drastic structural change. In OSN, polyimide and cross‑linked polyacrylonitrile (PAN) are common because they resist swelling and dissolution in many organic solvents. A stable membrane ensures that pressure-induced compaction is predictable, rather than a runaway collapse that destroys selectivity.
How Feed Solute Concentration Acts as a Hidden Brake
Concentration Polarization: The Invisible Wall
In dilute laboratory experiments (under 1 wt%), concentration polarization is often negligible. In a pilot plant operating at realistic industrial concentrations above 5 wt%, it becomes the dominant mass-transfer limitation. Rejected solutes accumulate at the membrane surface, forming a stagnant, high‑concentration boundary layer. This is concentration polarization—it raises the local osmotic pressure, reduces the effective transmembrane pressure, and throttles solvent transport.
Osmotic Pressure Eats Your Driving Force
The osmotic pressure difference across the membrane acts directly against your applied pressure. A higher feed concentration creates a steeper concentration gradient, which translates to a higher osmotic pressure at the membrane wall. The result is less net driving force for permeation, lower flux, and a drop in observed rejection because the membrane sees a much higher local solute concentration than what you measure in the bulk fluid.
The Viscosity and Gelation Risks
Beyond osmotic effects, high local solute concentrations increase the viscosity of the boundary layer fluid. A more viscous layer further impedes mass transfer. If the interface concentration reaches the solute’s solubility limit, gelation occurs—leading to a rapid, often irreversible performance collapse. Pilot plant operators must monitor this closely when processing high-concentration feeds.
Modeling Reality: Solution‑Diffusion Meets Film Theory
To accurately predict pilot-scale performance, simple transport models must be coupled with film theory. This integrated approach accounts for the mass transfer coefficient in the boundary layer and the different chemical activities on both sides of the membrane. Without it, flux and rejection predictions will be hopelessly optimistic at industrial solute loadings.
Strategies to Fight the Boundary Layer
Crossflow Velocity: Your Primary Defense
While pressure and feed concentration dominate, you can mitigate concentration polarization by increasing the crossflow velocity. A higher flow rate raises the mass transfer coefficient near the membrane, sweeping accumulated solute away. This effectively lowers the solute concentration at the interface, reduces osmotic pressure, and recovers some of the lost flux. In a pilot plant, adjusting the recirculation pump speed is the most direct way to combat polarization without changing the feed composition.
Solvent and Membrane Pairing
The choice of membrane material is equally critical. For aggressive polar aprotic solvents like DMF or THF, chemically cross‑linked polyimide membranes maintain structural integrity and high rejection (above 0.95) for solutes larger than their molecular weight cut-off. A stable membrane resists swelling, which would otherwise accelerate concentration polarization and compromise rejection. Matching the membrane’s hydrophilic or hydrophobic nature with the solvent matrix prevents excessive sorption that can plasticize the material and increase solute passage.
Understanding the Trade‑offs
Pressure and feed concentration are locked in a constant tug‑of‑war with membrane stability and mass transport. Increase pressure, and you may initially boost flux—but you also risk compaction and severe concentration polarization. Reduce feed concentration, and many problems disappear—but industrial streams rarely offer that luxury. Operating at a lower pressure reduces flux and rejection, demanding a larger membrane area. Raising crossflow velocity helps, but it increases pumping costs and may shear delicate solutes.
A particularly subtle dynamic appears at high pressure: compaction increases membrane resistance, making the boundary layer resistance proportionally less significant. This doesn’t eliminate concentration polarization; it just means the membrane itself becomes the bigger bottleneck. At moderate pressures with high‑concentration feeds, the boundary layer dominates performance. In an educational or research pilot plant, these trade‑offs are exactly what you need to explore to truly understand real‑world mass‑transfer limitations.
Making the Right Choice for Your Pilot Plant Goal
Your operating strategy must align with your primary objective. Use these starting points to guide your experimental design:
- If your primary focus is maximizing flux for solvent recovery: Start at a moderate pressure (10–20 bar) where compaction is minimal, and maximize crossflow velocity to suppress concentration polarization. Watch for any flux decline that signals gelation.
- If your primary focus is achieving the highest solute rejection: Prioritize a membrane with a tight molecular weight cut-off that is chemically stable in your solvent. Operate at a pressure that provides sufficient driving force but avoids pushing the boundary layer concentration to the solubility limit. Lower feed concentrations will make high rejection easier to maintain.
- If your primary focus is studying mass-transfer fundamentals: Deliberately vary feed concentration (1–10 wt%) and pressure (5–40 bar) while measuring mass transfer coefficients. Correlate experimental flux and rejection with the coupled film‑theory/solution‑diffusion model, and document compaction trends. This dataset is invaluable for scaling from pilot to production.
Never forget that in OSN, what you measure as bulk concentration is not what the membrane experiences. The real separation battle happens within a few hundred micrometers of the membrane surface. Mastering that boundary layer is the foundation of consistent, high‑performance organic solvent nanofiltration.
Summary Table:
| Parameter | Effect on Permeate Flux | Effect on Solute Rejection | Primary Mechanism / Risk |
|---|---|---|---|
| Low Pressure | Decreases | Decreases | Reduced net transmembrane driving force |
| High Pressure | Increases (non-linearly) | Increases | Membrane compaction & concentration polarization |
| Low Feed Concentration | Remains High / Stable | Remains High | Negligible boundary layer resistance |
| High Feed Concentration | Decreases | Decreases | High osmotic pressure & concentration polarization |
Enhance Your Chemical Engineering & Process Labs with LABPARK
Mastering complex mass-transfer phenomena like organic solvent nanofiltration requires robust, reliable, and precise equipment. LABPARK provides state-of-the-art Educational and Vocational Unit Operations Pilot Plants in chemical engineering, bioprocess & biotech, and environmental & water treatment designed specifically for universities, research institutes, and enterprises.
Our pilot plants empower students and researchers to safely test variables, analyze membrane stability, and scale up operations with confidence.
Contact LABPARK today to discuss your training or research requirements and receive a customized technical proposal!
Related Products
- Multi-Functional Membrane Separation Educational Pilot Plant for Unit Operations Lab
- Multifunctional Membrane Separation Educational Pilot Plant with Ultrafiltration, Nanofiltration, Reverse Osmosis
- Natural Product Extraction Unit Operations Training Pilot Plant
- Multi Functional Membrane Crystallization Educational Unit Operations Pilot Plant
- Photocatalytic Membrane Separation and Degradation Unit Operations Pilot Plant
People Also Ask
- What are the key differences in membrane configurations? Choose the Right Unit Operations Pilot Plant
- How Do Pervaporation, Vapor, and Gas Permeation Differ in Pilot Plants? Key Comparison
- How do membrane separation pilot plants teach RO limits? Master osmotic pressure dynamics.
- How do temperature and pH affect membrane conductivity? Pilot Plant Guide
- How do polymer membranes restrict gas separation? Key pilot plant limits.