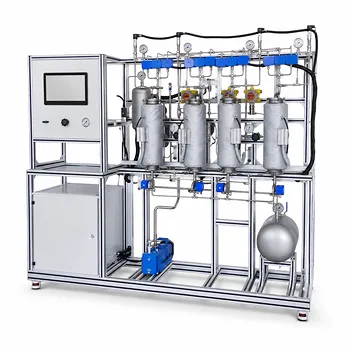
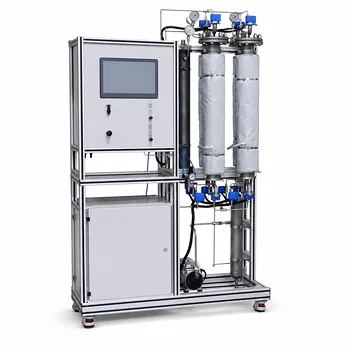
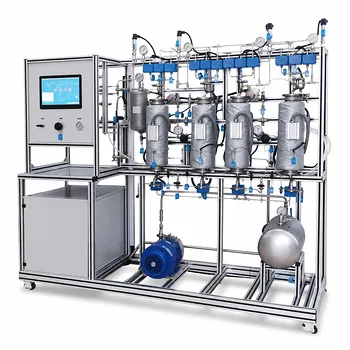
The liquid-to-gas flow rate ratio is the master control dial that sets both the height and the operating cost of an absorption column. In an educational pilot-plant column, this ratio directly determines the slope of the operating line, which governs the mass transfer driving force and, in turn, the number of transfer units (N_{OG}) needed for a given separation. When students adjust the solvent flow rate relative to the gas flow, they tangibly observe how a smaller ratio requires a taller column, while a larger ratio shrinks the column but raises solvent and regeneration expenses.
The (L/G) ratio defines the economic and physical boundary of an absorber. At the minimum ratio, the driving force vanishes and column height becomes infinite—a hard thermodynamic limit. In practice, educational units operate at 1.1 to 2.0 times this minimum, a window that allows students to measure how changes in flow rate shift the required transfer units, separation efficiency, and column hydraulics.
The Physics Linking Flow Rates to Column Performance
The Operating Line and Equilibrium Curve
Gas absorption moves a solute from a gas into a liquid. The process is bounded by two lines on a mole-fraction diagram: the equilibrium curve (Henry’s law) and the operating line, which comes from a material balance.
The operating line’s slope is simply (L_m / G_m) (the ratio of liquid to gas molar flow rates). A steeper slope means more liquid is available to absorb the solute, pulling the operating line further from the equilibrium curve and creating a larger concentration driving force.
The Absorption Parameter (m G_m / L_m) and Driving Force
The dimensionless group (m G_m / L_m) (where (m) is the equilibrium slope) is a normalized measure of that driving force. Engineering literature, including classic work by Colburn, identifies an optimum range of 0.7 to 0.8 for this parameter.
When (m G_m / L_m < 0.8), the operating line is sufficiently steep, and the mass transfer push remains strong. As the ratio climbs toward 1.0, the operating line approaches the equilibrium curve, the driving force shrinks, and the separation becomes progressively harder.
Number of Transfer Units (N_{OG}) and Column Height
The number of transfer units (N_{OG}) is the primary design output that translates the operating line into physical height. (N_{OG}) expresses how many “steps” of mass transfer are required to go from inlet to outlet gas composition.
A lower (L_m / G_m) (hence a larger (m G_m / L_m)) always inflates (N_{OG}). Since column height is the product of (N_{OG}) and the height of a transfer unit, a smaller liquid flow forces a taller column—or, if the ratio hits the minimum, an infinitely tall one.
Design Consequences of Changing the (L/G) Ratio
Column Height and Packing Volume
Designers choose a target (L/G) to balance capital cost against operating cost. A ratio just above the minimum yields the smallest possible packed height for a low-liquid scenario, but any small flow disturbance can drop the driving force to zero.
Pilot plants make this visible: students can increase liquid flow and watch the required (N_{OG}) plummet, then calculate how much less packing material would be needed in a scaled-up unit.
Liquid Distribution and the Minimum Wetting Rate
Even when the absorption parameter is favourable, the column cannot work if its packing is dry. Every packing material has a minimum wetting rate—the lowest liquid load that fully wets its surface.
If the chosen (L/G) reduces the liquid rate below this threshold, dry zones form, effective interfacial area collapses, and efficiency plummets regardless of the theoretical driving force. Educational columns must always verify that the set liquid flow satisfies both the absorption target and the wetting limit.
Tray Hydraulics and Liquid Flow Patterns
In small educational columns (diameters often below 1.0 m), low liquid rates from a typical (L/G) selection favour single‑pass crossflow trays because they provide enough contact path length without drowning the downcomers. Only much larger pilot plants or high-liquid‑load experiments need multi‑pass trays to manage gradients.
Operational Realities in an Educational Pilot Plant
Setting the Actual Operating Range
The minimum liquid-to‑gas ratio ((L/G)_{\text{min}}) is the thermodynamic pinch point where the operating line touches the equilibrium curve. No real column can operate there.
Practical pilot-plant runs therefore set the operating ratio to 1.1 to 2.0 times the minimum, with 1.4 being a common default. This range guarantees a healthy driving force while keeping solvent usage reasonable.
Observing Trade‑offs: Removal Efficiency vs. Solvent Cost
When operators raise (L/G), the outlet gas becomes cleaner—and the outlet liquid becomes more dilute. That dilute liquid costs more to regenerate.
In an afternoon lab session, students can fix the gas rate, step the solvent flow from 1.2 to 1.8 times minimum, and record the drop in exit gas concentration alongside the rise in pump power and measured liquid temperature, turning a theoretical trade-off into hard data.
Flooding and Turndown Limits
A too‑high liquid rate not only wastes solvent; it can flood the column, filling void spaces with liquid and causing a rapid rise in pressure drop with little extra mass transfer. Conversely, a too‑low ratio risks weeping, channeling, or distributor failure. Every pilot plant experiment must stay between the column’s turndown and flood limits.
Understanding the Trade‑offs: Capital Cost, Operating Cost, and Reaction Type
The (L/G) ratio sits at the centre of a three‑way balance.
- Lower (L/G): Reduces solvent pumping and thermal regeneration loads but drives (N_{OG}) up, requiring a taller, more expensive column.
- Higher (L/G): Shortens the column but dilutes the outlet liquid, raising downstream energy costs and potentially breaching flooding limits.
- Slow chemical reactions: When the liquid‑phase reaction is rate‑limiting ((k_{la} \gg k_i^*)), increasing the specific surface area alone does not help; the system needs liquid holdup volume. In such cases, a pilot‑scale bubble column (with a much larger bulk liquid ratio (\alpha_1)) may be a better match than a packed column, and the operating (L/G) must be chosen to maintain that holdup, not just the absorption driving force.
Making the Right Choice for Your Pilot‑Plant Goal
Every educational absorption run must anchor its flow rates to a clear experimental objective. Use the following guidelines to match the (L/G) ratio to your learning aim:
- If your primary focus is demonstrating mass‑transfer fundamentals: Start at (L/G = 1.4 \times (L/G){\text{min}}). Measure (N{OG}) and outlet concentration, then vary the ratio to plot removal efficiency against flow rate, creating a live illustration of the operating‑line concept.
- If your primary focus is pushing toward low‑solvent operation: Gradually reduce (L/G) toward (1.1 \times (L/G){\text{min}}) while watching (N{OG}) rise sharply. Document the column height that would be needed at each ratio to anchor the capital‑cost side of the trade‑off.
- If your primary focus is robust, repeatable data: First, calculate the minimum wetting rate for your packing. Choose an (L/G) that comfortably exceeds both that wetting limit and (1.2 \times (L/G)_{\text{min}}), then log pressure drop to verify you are well away from flooding.
The liquid‑to‑gas ratio is not just a number on a rotameter—it is the single most powerful knob you can turn to connect thermodynamics, equipment design, and operating economics into one teachable moment. Turn it thoughtfully, measure everything, and the column will teach the lesson itself.
Summary Table:
| Parameter | Low L/G Ratio (Close to Min) | High L/G Ratio |
|---|---|---|
| Driving Force | Low (Operating line close to equilibrium) | High (Operating line far from equilibrium) |
| Column Height ($N_{OG}$) | Taller column required (Higher capital cost) | Shorter column required (Lower capital cost) |
| Solvent Consumption | Minimal (Low pumping & regeneration cost) | High (Elevated operating & energy costs) |
| Operational Risks | Dry packing (Below minimum wetting rate) | Column flooding, weeping, high pressure drop |
Bring Chemical Engineering Theory to Life with LABPARK
Are you looking to provide students and researchers with hands-on, practical experience in mass transfer and fluid hydraulics?
LABPARK designs and manufactures high-quality Educational and Vocational Unit Operations Pilot Plants specializing in chemical engineering, bioprocess & biotech, and environmental & water treatment. Specifically built for universities, research institutes, and enterprises, our systems offer:
- Clear Visual Learning: Transparent columns that let students observe wetting, loading, and flooding in real-time.
- Precise Process Control: Industrial-grade instrumentation to accurately study the effects of L/G ratios and mass transfer coefficients.
- Robust & Safe Operation: Built with safety interlocks and durable components for repeated educational use.
Empower the next generation of engineers with industry-ready training. Contact LABPARK today to discuss your laboratory's custom pilot plant requirements!
Related Products
- Packed Bed Absorption Educational Unit Operations Pilot Plant
- Absorption and Desorption Educational Unit Operations Pilot Plant
- Bench Scale Dual Column Gas Separation and Capture Educational Pilot Plant
- Pressure Swing Adsorption Educational Unit Operations Pilot Plant
- Multimodal Absorption and Desorption Pilot Plant for Unit Operations Training
People Also Ask
- How Do Flow Regimes Transition in Packed Bed Pilot Plants? Key Scale-up Insights
- How does reactant concentration determine absorption column control? Gas-film vs. dual-film.
- How is the packing height of an absorption column calculated? Master HTU & NTU Concepts
- How does the wall effect impact packed-bed conversion? Essential pilot plant scale-up tips.
- How does static vs. operating holdup affect pilot plant calibration? Avoid Critical Scale-Up Errors