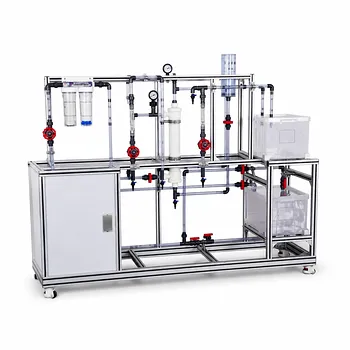
Your predictive path begins with a single, measurable constant for each pure solvent. By running simple pilot-plant tests to establish a permeability database on your target membrane, you can mathematically reconstruct the flux behavior of binary, ternary, and quaternary mixtures—no trial-and-error blending required.
The core insight is that multi-component OSN transport follows the same fundamental parameters that govern pure-solvent flow. When the membrane–solvent interaction is captured by a transport model (solution-diffusion or pore-flow), the mixture flux becomes a direct function of the pure-component permeabilities. This transforms pilot-plant data into a predictive engine, drastically shrinking the experimental burden.
The Principle Behind Pure-Solvent Prediction
How a Single Solvent Gives You a Transport Parameter
Measuring pure solvent flux through a membrane under fixed operating conditions yields a specific permeability (or a related transport coefficient). This number encodes the combined effects of:
- Membrane structure (pore size, free volume, active-layer thickness)
- Solvent properties (molar volume, viscosity, solubility)
- Driving force (transmembrane pressure or chemical potential gradient)
Once you have this single value for each solvent, you have the fundamental building block for mixture prediction.
The Model Does the Math
Standard transport models—solution-diffusion and pore-flow—describe flux using parameters that are linear with respect to driving force. For a pure solvent, the experimental flux pins down that parameter unambiguously.
When you move to a mixture, the model stays the same; you simply insert the pre‑measured pure‑component parameters into the flux equation. No additional fitting is needed. The mixture flux becomes a weighted sum of the individual contributions, governed by each solvent’s driving force and its pure‑state parameter.
From Binary to Multi‑Component Mixtures
Binary Mixtures Need Only Two Pure‑Solvent Numbers
A binary mixed solvent system is described by a two‑parameter model. You take the permeability (or pore‑flow coefficient) of Solvent A and Solvent B—both measured as pure liquids—and combine them according to the transport equation.
The result is a prediction of both the total organic flux and the separation of the two solvents. Pilot-plant test runs with mixtures can then be used for validation only, not discovery.
Ternary and Quaternary Mixtures Follow the Same Rule
The approach scales naturally. A ternary mixture becomes a three‑parameter problem: one pure‑solvent parameter per component. A quaternary mixture is a four‑parameter problem.
All parameters come from the same single‑solvent pilot experiments. There is no exponential growth in the number of required measurements. Researchers can thus map out an enormous formulation space while running only a fraction of the mixtures experimentally.
Building a Predictive Database with Pilot Plants
A unit‑operations pilot plant is the ideal environment to generate these pure‑solvent parameters. By systematically flowing each solvent of interest through a commercial OSN membrane at a standard temperature and pressure, you compile a permeability library.
This library then serves as a lookup table. When a new formulation is proposed, you pull the relevant pure‑solvent values, plug them into the model, and calculate the expected flux a priori. The pilot plant becomes a prediction engine rather than a bottleneck.
Understanding the Trade‑offs
When Predictions Are Less Accurate
Pure‑solvent parameters capture dilute‑state solvent‑membrane interactions. In some mixtures, strong solvent‑solvent interactions (e.g., hydrogen bonding, large viscosity deviations) can alter the effective membrane transport environment.
If the mixed solvent swells or densifies the membrane in a way that cannot be expressed as a linear combination of pure‑solvent behaviors, predictions will drift. Researchers must recognize that high‑accuracy applications may still require a few confirmatory mixture runs.
The Model Assumes No Coupling Between Solvent Flows
The straightforward parameter‑based approach assumes that each solvent’s flux is independent of the others, except for the shared driving force. In reality, coupling effects (such as convective drag in pore‑flow or competitive sorption in solution‑diffusion) can occur.
When coupling is significant, a pure‑solvent‑based prediction may under‑ or over‑estimate real mixture flux. This is particularly true for mixtures of very dissimilar molecular size or polarity.
You Need Consistent Measurement Conditions
Pilot‑plant‑derived permeability values are only reliable if the membrane’s state (compaction, temperature, pressure) is held constant across all pure‑solvent runs. Even small shifts in compaction or temperature will degrade prediction accuracy.
Therefore, a rigorous standard operating procedure for pure‑solvent flux measurement is essential. The database is only as trustworthy as the protocol that created it.
Making the Right Choice for Your Research Goal
The question is not if you should use pure‑solvent flux data, but how to integrate it into your workflow for maximum impact.
- If your primary focus is rapid screening of many solvent formulations: Build a pure‑solvent permeability database upfront. This enables a‑priori flux calculations and eliminates up to 80% of trial‑and‑error runs.
- If your primary focus is final process verification: Use pure‑solvent predictions to select the top candidates, then run only those as mixtures. This reserves experimental resources for the most promising blends.
- If your primary focus is working with chemically aggressive or expensive solvents: Rely on the predictive model to minimize the volume and number of hazardous or costly solvent mixtures you must handle in the pilot plant.
- If your primary focus is scaling from lab to production: Use pilot‑plant pure‑solvent data to define process windows and membrane performance curves, providing a solid foundation for future scale‑up decisions.
Your existing pilot plant is a repository of hidden predictive power. By shifting from mixture‑only testing to a pure‑solvent parameter mapping strategy, you turn that equipment into a forward‑looking design tool.
Summary Table:
| Metric | Pure-Solvent Predictive Modeling | Traditional Empirical Testing |
|---|---|---|
| Workload | Low (1 run per pure solvent) | High (Requires testing every mixture ratio) |
| Screening Speed | Fast (A-priori mathematical calculation) | Slow (Sequential trial-and-error runs) |
| Solvent Waste | Minimal (Only pure components tested) | High (Large volumes of mixed solvents) |
| Best Used For | Rapid formulation screening & scale-up | Final process validation & verification |
Accelerate Your Membrane Separation Research with LABPARK
Ready to turn your pilot plant into a powerful predictive engine? LABPARK provides state-of-the-art Educational and Vocational Unit Operations Pilot Plants in chemical engineering, bioprocess & biotech, and environmental & water treatment. Specially designed for universities, research institutes, and enterprises, our advanced systems deliver the highly precise, repeatable pure-solvent flux data you need to model complex multi-component OSN systems accurately.
Streamline your membrane screening, minimize chemical waste, and scale up your processes with confidence. Contact our specialists today to find the perfect pilot plant solution for your facility!
Related Products
- Multifunctional Membrane Separation Educational Pilot Plant with Ultrafiltration, Nanofiltration, Reverse Osmosis
- Multi-Functional Membrane Separation Educational Pilot Plant for Unit Operations Lab
- Natural Product Extraction Unit Operations Training Pilot Plant
- Carbon Dioxide Absorption and Desorption Educational Pilot Plant for Carbon Capture Studies
- Hot Filtration Educational Unit Operations Pilot Plant Laboratory System
People Also Ask
- Pervaporation vs. Vapor Permeation: Handling Suspended Solids in Membrane Pilot Plants
- How do PEI, PVDF, and PSU membranes compare in pilot plants? Find the best fit.
- What are the trade-offs of polymer vs inorganic membranes in teaching pilot plants? Key laboratory comparison.
- What are the key flow configuration loops in membrane pilot plants? Optimize Performance
- What are the advantages of membrane separation in pilot plants? Efficient Organic Vapor Recovery