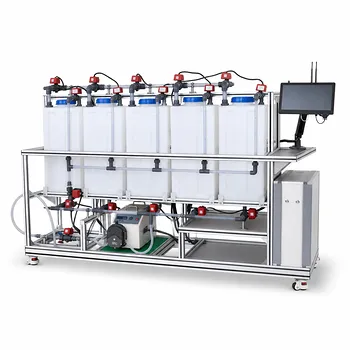
Unlocking real-time process insight through online spectroscopy The integration of online UV‑vis spectroscopy into an ion‑exchange pilot plant revolves around a continuous flow‑through measurement loop that scans the column effluent for metal‑ion absorbance. Common interferences such as bubbles and lamp drift are managed with a dual‑channel reference fiber, a purpose‑built flow cell with a wide inner diameter, and chemometric models that track pH‑sensitive peak shifts.
The practical recipe combines three elements: a dual‑beam referencing system to cancel lamp drift, a flow cell with a 5 cm inner diameter to let bubbles pass without disturbing the light path, and chemometric algorithms that lock onto the correct wavelength window even when pH changes shift the absorbance peak. This integrated approach transforms the UV‑vis instrument from a fragile lab tool into a rugged, real‑time process monitor.
The Architecture of an Online UV-Vis System for Ion Exchange
Continuous Flow Sampling from the Column Effluent
A bypass or slipstream is drawn directly from the ion‑exchange column outlet and routed to a flow cell inside the spectrometer. The sample is never “grabbed” manually; it flows continuously, ensuring that every data point represents the instantaneous concentration leaving the column.
This setup eliminates the typical 10‑to‑30‑minute delay of offline analysis. In a pilot plant setting—whether for nickel recovery or catalyst metal recycling—that lag can completely miss the sharp concentration rise that defines a breakthrough event. By continuously scanning the effluent, the system delivers a high‑resolution, real‑time absorbance signal that mirrors the column’s behavior second by second.
The Dual-Channel Advantage: Compensating for Lamp Drift
A single‑beam setup is vulnerable to lamp intensity fluctuations, which look like concentration changes and corrupt the data. The solution is a dual‑channel (dual‑beam) configuration: one fiber optic carries the light through the sample flow cell, while a parallel reference fiber loop bypasses the sample altogether.
The reference channel continuously measures the raw lamp output. Any drift—caused by temperature, aging, or power instability—appears in both channels identically. By ratioing the sample signal against the reference in real time, the system mathematically cancels the drift. This leaves only true absorbance changes from the metal ions, delivering a stable baseline even during long multi‑hour breakthrough experiments.
Practical Strategies for Interference Management
Combating Bubbles with a Larger Flow Cell Path
Bubbles are the most pervasive interference in online liquid spectroscopy. A tiny air pocket crossing the light beam scatters light and creates sharp, false absorbance spikes that mimic a sudden metal spike.
The most straightforward defense is geometric: a flow cell with a larger inner diameter—typically 5 cm—gives bubbles enough room to rise and pass outside the narrow optical interrogation zone. Think of it as widening a highway so that a stray bicycle doesn’t block all traffic. In a wide‑path flow cell, bubbles tend to hug the upper wall and drift out of the light beam, leaving transmission largely unaffected. The result is a cleaner signal and far fewer false alarms.
Dual‑channel referencing also helps here. If a bubble does partially occlude the sample path, the absorbing baseline may shift, but the reference channel remains pure, making the event easy to flag and discriminate from a real concentration change.
Correcting for pH-Induced Spectral Shifts with Chemometrics
The absorbance peak of a metal ion is not fixed; it can shift with pH. As the ion‑exchange medium’s local chemistry evolves, the wavelength of maximum absorbance may drift by a few nanometers. A simple single‑wavelength measurement will read a drop even if the concentration is unchanged—a classic misinterpretation.
Chemometric models solve this by tracking an entire spectral window rather than a single point. Algorithms like partial least squares (PLS) or principal component regression are trained on spectra collected under different pH conditions. The model learns the shape of the peak and its shifting behavior, then extracts the true concentration regardless of where the peak sits within the window. This adaptive tracking ensures accurate monitoring during pH transients that are common in student laboratory runs or process‑development trials.
Why Real-Time Monitoring Outperforms Offline Grab Samples
Eliminating the 10-to-30-Minute Lag Time
Offline sampling introduces a dead zone where the column is essentially unmonitored. Between the time a sample is taken and the analysis result is available, the breakthrough front can move significantly. In a pilot plant, that lag translates directly into lost recovery or accidental release.
Online UV‑vis spectroscopy collapses that delay to seconds. The effluent never stops being measured. Operators see the rising concentration as it happens, allowing them to trigger flow diversion, protect downstream equipment, or maximize column loading without guesswork.
Capturing the Full Breakthrough Curve with Precision
Breakthrough is not always a gentle slope; it can be a sharp, almost step‑like event. Offline samples spaced minutes apart often miss the exact inflection point, leading to inaccurate mass balance calculations and poor kinetic models.
With online integration, the system captures a dense data set—often a point every few seconds—that traces the concentration curve in fine detail. Students and researchers can watch the breakthrough curve build dynamically, identify anomalies caused by bubbles or particulates immediately, and refine their models with unprecedented confidence.
Understanding the Trade-offs
The Limits of a 5 cm Path Length
While a wide‑diameter flow cell mitigates bubbles, longer path lengths can reduce sensitivity for trace concentrations if the optical design isn’t optimized. A 5 cm cell trades off some path length compared to narrow‑bore high‑sensitivity cells, meaning the detection limit may rise. However, in ion‑exchange breakthrough monitoring, the concentrations of interest—tens to hundreds of mg/L—are usually well above the noise floor of a 5 cm system. For ultra‑trace work, additional signal averaging or a low‑dispersion flow cell with active debubbling might be required.
Model Maintenance and Recalibration Needs
Chemometric models are not “set and forget.” The training set must cover the range of pH, temperature, and ionic strength encountered in the plant. If the process chemistry shifts outside the calibration space (e.g., a new buffer is used), prediction accuracy degrades silently. Regular validation with offline reference samples—perhaps once per campaign—keeps the model honest. This maintenance overhead is the price for robustness against spectral shifts.
Making the Right Choice for Your Pilot Plant
Your implementation strategy should align with your primary objective. Use these goal‑driven recommendations to decide where to focus your effort.
- If your primary focus is maximizing column utilization: Prioritize the dual‑channel online setup with a wide‑bore flow cell. The real‑time signal lets you stop loading at the exact breakthrough point, recovering every possible gram of valuable metal without over‑running.
- If your primary focus is generating high‑quality kinetic data: Invest in the chemometric model and high‑frequency data logging. The dense, pH‑corrected concentration curves will give you the temporal resolution needed for reliable rate constant estimation.
- If your primary focus is student learning and troubleshooting ease: Use the dual‑channel reference and 5 cm flow cell to make interference detection obvious. The system becomes a transparent teaching tool where a bubble spike is visually distinct from a true breakthrough, reinforcing core process‑analytical concepts.
Armed with a referencing architecture, a bubble‑tolerant flow geometry, and adaptive chemometrics, online UV‑vis spectroscopy becomes a precise, resilient window into your ion‑exchange process—transforming breakthrough monitoring from a post‑mortem exercise into a real‑time decision‑making tool.
Summary Table:
| Challenge | Solution | Key Benefit |
|---|---|---|
| Measurement Lag | Continuous bypass flow sampling | Real-time breakthrough data in seconds |
| Lamp Drift | Dual-channel referencing system | Cancels lamp intensity drift automatically |
| Bubble Interference | 5 cm wide-path flow cell | Lets bubbles pass outside the light path |
| pH-Induced Peak Shifts | Multi-wavelength chemometrics (PLS) | Tracks concentration accurately despite pH changes |
Optimize Your Process with LABPARK Pilot Plants
Are you looking to bring real-time analytical precision to your research or curriculum? LABPARK provides advanced Educational and Vocational Unit Operations Pilot Plants in chemical engineering, bioprocess & biotech, and environmental & water treatment. Tailored for universities, research institutes, and enterprises, our rugged systems are designed to support seamless online sensor integration (like UV-vis spectroscopy) to deliver hands-on learning and precise experimental data.
Contact LABPARK today to discover how our custom pilot plant solutions can enhance your laboratory's capabilities and efficiency!
Related Products
- Ion Exchange Water Purification Educational Pilot Plant for Engineering Unit Operations
- Comprehensive Liquid-Liquid Extraction Pilot Plant for Engineering Education
- Constant Pressure Filtration Educational Unit Operations Pilot Plant
- Dual Mode Heat Transfer Pilot Plant for Unit Operations Training
- Dual-Mode Rectification Pilot Plant for Practical Training Unit Operations
People Also Ask
- How to Prevent Ion Exchange Channeling? Expert Solutions for Pilot Plants
- How does ion exchange work in water treatment pilot plants? Cost & process guide.
- What operational precautions should lab operators take for resin volume changes and air pockets? Key Guide
- How to use ion exchange pilot plants to verify alkalinity? A hands-on guide for engineering students.
- How can students use ion exchange pilot plants for column sizing? Master Wastewater Design