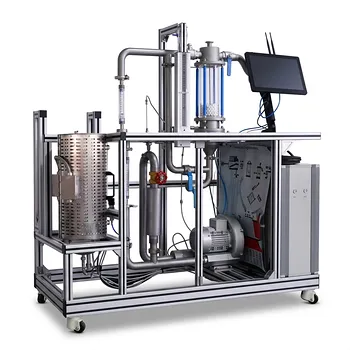
The pressure-drop-versus-velocity relationship in a fluidized bed is not just a lab exercise—it is the critical diagnostic fingerprint of the entire gas-solid system.
Measuring this relationship allows you to experimentally pinpoint the minimum fluidization velocity ($u_{mf}$) and clearly observe the transition from a fixed bed to a fully fluidized state. It also provides an immediate, real-world signal of operational failures like gas channeling or slugging, which every chemical engineer must learn to recognize before scaling up a process.
The core takeaway is that the bed pressure drop versus superficial gas velocity curve serves as a living map of bed behavior. In a stable bed, the curve's plateau directly verifies that the gas’s drag force perfectly balances the particle weight—any deviation from this ideal signature is a loud, actionable warning of poor fluidization, bypassing, or mechanical instability.
Unlocking the Fluidization Curve: From Fixed Bed to Fluidized
The Theoretical Blueprint: What the Curve Tells You
In a packed bed, pressure drop rises nearly linearly with increasing gas velocity as friction forces dominate.
Once the velocity reaches $u_{mf}$, the particles begin to float freely, and the pressure drop stabilizes at a constant value exactly equal to the buoyant weight of the bed per unit area.
That sharp corner on the curve is the experimental definition of $u_{mf}$, a parameter no amount of textbook reading can give you accurately for your specific material.
The Practical Value: Why You Can’t Just Simulate It
Empirical equations like the Ergun equation provide a beautiful starting point, but real particles are never perfectly spherical, and particle size distributions change packing behavior.
In a pilot plant, you measure the true $\Delta p$–$u_o$ behavior under your own conditions, allowing you to validate or correct those models and build confidence for reactor scale-up.
This direct measurement is what prevents you from grossly undersizing a compressor or, worse, operating in a regime where the bed never fluidizes uniformly.
Diagnosing Hidden Problems Through Pressure Drop Signatures
Recognizing Stable Fluidization
A healthy fluidized bed pressure drop hovers near a constant value with only minor, high-frequency fluctuations caused by normal bubble activity.
The curve’s flatness confirms that the drag force is evenly supporting the entire inventory of solids—this is the golden standard you’re trying to maintain.
The Telltale Signs of Slugging
Slugging emerges when the bed height-to-diameter ratio is too large or gas velocity is too high, causing bubbles to grow to the column diameter.
On the pressure drop curve, slugging shows up as violent, periodic oscillations that can physically shake the column.
Seeing these spikes in your data teaches you to immediately adjust the bed geometry or gas flow before mechanical damage occurs.
Spotting Channeling and Gas Bypassing
Channeling happens when the gas cuts a short-circuit path through the bed, often because of uneven gas distribution or sticky, cohesive particles.
The measured pressure drop will be significantly lower than the theoretical fluidization pressure drop—a clear sign that most of the bed material is not being fluidized at all.
Recognizing this low, smooth pressure drop as a fault (not a success) is one of the most important diagnostic lessons a pilot-plant session can teach.
The Deeper Educational Impact: Thinking Like an Engineer
From Classroom Equations to Real-World Complexity
Unit operations labs aren’t just about one curve; they train you to understand that every elbow, valve, and flow meter in the supply line adds its own friction loss.
The pressure drop across the bed must be interpreted alongside the entire system pressure budget, especially when handling compressible gases or non-Newtonian fluids where idealized software models often fail.
Building Intuition for Process Scale-Up
The curve you measure on a small column is the seed of your scale-up strategy. Knowing where $u_{mf}$ falls and how the curve deviates from ideality warns you of potential flooding, slugging, or hot-spot formation in a larger unit.
This training burns the relationship into your engineering intuition, so you can later spot a poorly designed gas distributor just by looking at a differential pressure transmitter reading.
Pitfalls and Limitations to Watch For
Common Misinterpretations in the Lab
One of the biggest errors is assuming a constant pressure drop automatically means perfect fluidization; channeling can sometimes produce a steady, near-constant reading that is simply too low.
You must always corroborate the pressure drop data with a visual check of bed expansion and surface bubbling—data without context is dangerous.
Shortcomings of Lab-Scale Measurements
Wall effects and particle friction against a small column can distort the $\Delta p$–$u_o$ curve, making the transition to fluidization look smoother than it would be in a large industrial unit.
Internals like thermowells or probes inside a pilot column can create local dead zones, altering the measurement and masking channeling until you learn to identify the pattern.
Making the Most of Your Unit Operations Training
Now that you understand why this measurement is essential, here’s how to turn that knowledge into a sharp skill set.
- If your primary focus is mastering fluidization fundamentals: Force yourself to manually determine $u_{mf}$ from the $\Delta p$–$u_o$ curve and compare it to the theoretical Ergun equation prediction; note every difference as a learning point about real-particle behavior.
- If your primary focus is troubleshooting operational problems: Deliberately create slugging or channeling conditions (within safe limits) and record the pressure drop signature so you build a mental library of failure modes you can recognize in a future plant in seconds.
- If your primary focus is designing industrial reactors or dryers: Use the lab curve to extract the fluidization-quality window—move beyond $u_{mf}$ to find the velocity that gives the most stable pressure drop without dangerously high fluctuations, and treat that as your design point.
There is no substitute for the deep, instinctive understanding of fluidization that comes from watching a pressure drop curve unfold in real time—it transforms a mathematical relationship into a core engineering reflex.
Summary Table:
| Bed State / Phenomenon | Pressure Drop ((\Delta p)) Behavior | Engineering & Diagnostic Significance |
|---|---|---|
| Fixed Bed | Rises linearly with gas velocity | Frictional drag dominates; particles remain stationary. |
| Stable Fluidization | Constant plateau (balances bed weight) | Ideal state; verifies minimum fluidization velocity ((u_{mf})). |
| Slugging | Violent, periodic oscillations | Large bubbles venting; warns of potential mechanical damage. |
| Channeling | Significantly lower than theoretical (\Delta p) | Gas bypasses bed; signals poor gas-solid contact. |
Bring Hands-On Fluidization Concepts to Life with LABPARK
Looking to bridge the gap between textbook equations and real-world process engineering? LABPARK provides state-of-the-art Educational and Vocational Unit Operations Pilot Plants in chemical engineering, bioprocess & biotech, and environmental & water treatment for universities, research institutes, and enterprises.
Our pilot plants enable students and researchers to:
- Visualize and measure complex behaviors like pressure drop curves and fluidization transitions first-hand.
- Master diagnostic skills by identifying real-world faults like channeling and slugging on industrial-grade instrumentation.
- Build scale-up confidence with reliable data verification that prepares future engineers for industrial challenges.
Equip your laboratory with the tools to build true engineering intuition. Contact LABPARK today to request a catalog or discuss your custom lab configuration!
Related Products
- Fluid Friction Resistance Determination Educational Unit Operations Pilot Plant
- Constant Pressure Filtration Educational Unit Operations Pilot Plant
- Bernoulli Equation Demonstration Unit Operations Pilot Plant
- Packed Bed Absorption Educational Unit Operations Pilot Plant
- Two-Dimensional Fluidization Hydrodynamics Educational Pilot Plant for Unit Operations Training
People Also Ask
- How do pilot plants teach U-tube manometers? Master Differential Pressure Calculations
- How is the hydrodynamic entrance length estimated for high-Re channel flows? Design accurate pilot-plant measurements
- How do velocity profiles and flow rates differ in Newtonian and power-law fluids? A Pilot Plant Guide
- How do pilot plants demonstrate siphon pressure variations? Visualizing Bernoulli's Energy Balance
- How does high-frequency pressure oscillation affect velocity distribution and boundary layer behavior? Discover Stokes-layer effects