The success of every gas-liquid reaction hinges on a single, non-negotiable condition: the gas must be dispersed. In pilot-scale bioreactors and chemical reactors, operators must identify the critical rotational speed (N₀) and the flooding speed (N’) because these two thresholds define the boundaries of effective operation. N₀ is the speed at which the impeller completely overcomes gas buoyancy, dispersing bubbles throughout the vessel to maximize the interfacial area for mass transfer. N’ is the lower limit; below this speed, the gas simply escapes up the shaft without being distributed, rendering agitation useless.
Ignoring N₀ and N’ turns a precisely controlled reactor into an unpredictable black box. Identifying them in a pilot plant is not a theoretical exercise—it is the foundational step that ensures reliable mass transfer, prevents process failure, and anchors every subsequent scale-up calculation.
The Physics of Gas Dispersion: The Battle Against Buoyancy
A rotating impeller must impart enough kinetic energy to tear a rising gas stream into fine bubbles and push them radially outward. If it fails, the gas finds the path of least resistance straight up.
What Happens When the Impeller Floods (Below N’)
Flooding occurs when the impeller’s pumping capacity is overwhelmed by the upward buoyant force of the gas. At speeds below the flooding speed N’, the gas coalesces around the shaft and rises as a continuous plume.
The impeller essentially spins in a gas cavity, hardly contacting the liquid. Mass transfer collapses because the gas-liquid interfacial area plummets. In a pilot plant, operating in this regime wastes expensive reactants, corrupts kinetic data, and can lead to dangerous oxygen starvation in aerobic fermentations.
Crossing the Critical Threshold: Achieving Complete Dispersion (N₀)
As speed increases, the impeller begins to capture and break the gas. The critical rotational speed N₀ marks the exact moment when bubbles are dispersed to the vessel wall and begin recirculating with the liquid.
This is the point where the interfacial area—and thus the volumetric mass transfer coefficient (kLa)—approaches its maximum for a given gas flow rate. Every bioprocess or hydrogenation pilot study must locate N₀ because it defines the lower boundary of kinetically credible operation.
The Operational Spectrum: From Flooded to Fully Dispersed
The transition from N’ to N₀ is not a sharp on/off switch but a graduated spectrum of dispersion quality. Recognizing these stages helps operators set an appropriate working window for their specific process.
The Agitation Scale as a Practical Roadmap
Industrial practice classifies gas dispersion intensity on a numerical agitation scale, which directly aligns with the N’–N₀ framework.
- Scale 0: A flooded impeller. Gas rises directly up the shaft. This regime is unsuitable for any chemical or biological process.
- Scale 1–2: Coarse dispersion just beyond flooding. Suitable only for undemanding systems that are not mass-transfer limited.
- Scale 3–5: Moderate dispersion. Fine bubbles are driven to the vessel wall and recirculated. A pilot plant typically operates here for many standard reactions.
- Scale 6–10: Rapid mass transfer. The impeller maximizes bubble breakup and recirculation, creating the intense interfacial contact required for fast reactions or high-density cell cultures.
Identifying N’ and N₀ anchors this scale. N’ is the boundary of Scale 0, while N₀ roughly coincides with the entry into moderate-to-rapid dispersion. Without these markers, the “agitation scale” is just a guess.
The Hidden Cost of Ignoring N₀ and N’
A pilot plant’s primary purpose is to generate data that predicts commercial-scale behavior. Disregarding the two critical speeds poisons that data in ways that compound downstream.
Compromised Mass Transfer and Reaction Kinetics
Below N₀, the gas-liquid interfacial area is unpredictable and hypersensitive to small speed fluctuations. A researcher measuring a reaction rate in this zone is not measuring intrinsic kinetics; they are measuring an uncontrolled gas dispersion limitation.
Pilot experiments at the wrong speed can make a perfectly viable catalyst or cell line appear sluggish, leading to costly reformulation or false negative decisions.
Scale-Up Pitfalls and the Data Mirage
Scale-up methodologies like equal power per volume or equal tip speed assume a consistent hydrodynamic regime. If the pilot data was generated near a flooding point while the large-scale design aims for full dispersion, the two systems sit in entirely different physical states.
The result is a pervasive “data mirage”: the pilot plant predicts a performance that the commercial reactor can never replicate. Determining N₀ and N’ and explicitly operating well above N₀ eliminates this ambiguity, turning pilot runs into a trustworthy foundation for scale-up.
Understanding the Trade-offs: The Limits of Speed
While reaching N₀ is essential, pushing speed far beyond it is not a one-way ticket to perfection. Objectivity demands a clear view of the downsides.
- Power and Heat Removal Costs: Power draw scales with the cube of impeller speed. A 20% speed increase above N₀ can add 70% more power, stressing motor limits and requiring more aggressive heat removal.
- Cell Shear Sensitivity: In bioreactors, excessive speed past N₀ can damage shear-sensitive mammalian cells or filamentous organisms, outweighing any mass transfer gain.
- Diminishing Mass Transfer Returns: Once complete dispersion is achieved, further speed increases yield progressively smaller improvements in kLa while amplifying all the associated costs.
The pilot plant’s job is not to find the highest speed, but to find the minimum speed that reliably achieves the required dispersion and mass transfer for that specific gas flow rate—a point typically just beyond N₀.
Making the Right Choice for Your Pilot Plant Goal
Your experimental objective dictates how you should use the N₀ and N’ data collected during a pilot plant campaign.
- If your primary focus is generating scalable reaction data: Operate at an agitation scale of 3–5 for standard processes or 6–10 for mass-transfer-limited reactions, always staying definitively above N₀ for your maximum planned gas flow rate.
- If your primary focus is maximizing aeration economy: Map N₀ across the entire operating range of gas flow rates, then choose the lowest combination of speed and gas flow that meets your oxygen transfer requirement without over-shearing the culture.
- If your primary focus is troubleshooting a new process: First, rule out flooding by confirming you are safely above N’. Then, incrementally approach N₀ to see if the performance deficit vanishes—this simple check resolves countless pilot plant mysteries.
A pilot plant that meticulously identifies the speed where flooding ends and complete dispersion begins transforms agitation from a maintenance setting into a precisely controlled process variable.
Summary Table:
| Regime | Speed Threshold | Dispersion State | Process Impact |
|---|---|---|---|
| Flooded | Below $N'$ | Gas escapes up the shaft in a plume | Mass transfer collapse; inaccurate kinetic data |
| Transition | Between $N'$ and $N_0$ | Partial bubble breakup & distribution | Unstable process window; scale-up risks |
| Complete Dispersion | At or above $N_0$ | Bubbles recirculated throughout vessel | Optimized $k_La$; reliable, scalable data |
Streamline Your Scale-Up with LABPARK
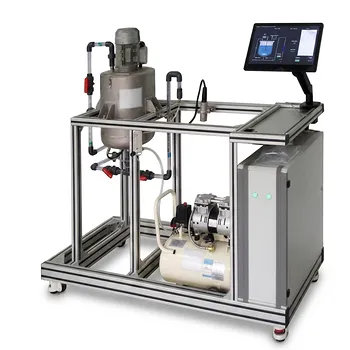
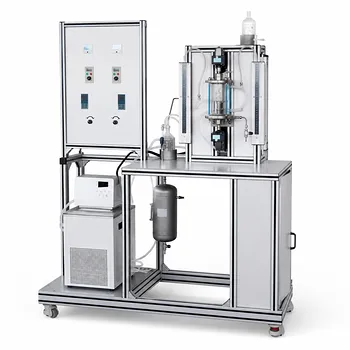
Achieving precise gas-liquid dispersion is critical for generating reliable, scalable pilot data. LABPARK provides premium Educational and Vocational Unit Operations Pilot Plants in chemical engineering, bioprocess & biotech, and environmental & water treatment.
Whether you represent a university, research institute, or enterprise, our systems are engineered to help you accurately map N₀ and N', ensuring optimal mass transfer and a seamless transition to production. Contact LABPARK today to discuss your pilot plant requirements!
Related Products
- Packed Bed Absorption Educational Unit Operations Pilot Plant
- Two Phase Flow Pattern Velocity Resistance Measurement Educational Pilot Plant
- Ternary Liquid-Liquid Equilibrium Educational Pilot Plant
- Agitation and Mixing Educational Unit Operations Pilot Plant
- Binary System Vapor Liquid Equilibrium Data Determination Educational Unit Operations Pilot Plant
People Also Ask
- How Do Flow Regimes Transition in Packed Bed Pilot Plants? Key Scale-up Insights
- How does reactant concentration determine absorption column control? Gas-film vs. dual-film.
- How is the packing height of an absorption column calculated? Master HTU & NTU Concepts
- How does the wall effect impact packed-bed conversion? Essential pilot plant scale-up tips.
- How does static vs. operating holdup affect pilot plant calibration? Avoid Critical Scale-Up Errors