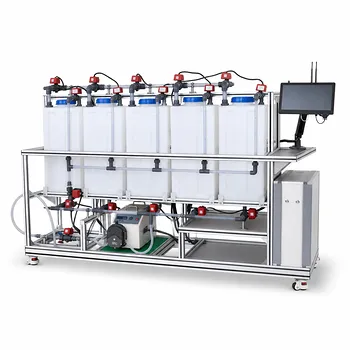
The direct link between a measurable voltage and a reaction’s fundamental thermodynamic favorability is the cornerstone of electrochemical process validation. In electrochemical unit operations pilot plants, this relationship is verified by measuring the open-circuit voltage (OCV) of a cell at equilibrium and applying the Nernst equation coupled with the fundamental thermodynamic identity. A single voltage reading, taken under precisely controlled conditions, yields the standard cell potential, the Gibbs free energy change, and the thermodynamic equilibrium constant, directly connecting an electrical signal to the ultimate reaction yield and spontaneity.
While textbooks present the equation (E^\circ = -\Delta G^\circ / nF) as an abstract concept, pilot plants make it tangible: measuring the open-circuit potential of a fully designed cell system under industrial-relevant flow and concentration conditions provides a direct, quantitative verification of the equilibrium position that governs that process.
How Open-Circuit Voltage Unlocks Thermodynamic Parameters
The core verification hinges on a deceptively simple measurement that, when performed with rigor, encapsulates the entire thermodynamic landscape of the cell reaction. Pilot plants are uniquely positioned to recreate the equilibrium conditions that make this possible.
The Three-Way Relationship at a Glance
When an electrochemical cell is at complete equilibrium—no net current flow—the measured open-circuit voltage equals the cell potential (E) that the Nernst equation describes.
At standard conditions (unit activities, 298 K) this becomes (E^\circ), directly linking to the standard Gibbs free energy change via (\Delta G^\circ = -nFE^\circ).
Substituting the equilibrium condition (\Delta G^\circ = -RT\ln K^\circ) yields the working equation (E^\circ = \frac{0.0591\ \text{V}}{n} \log_{10} K^\circ), valid at 298 K.
From Lab Glassware to a Scaled Pilot Cell
In an electrochemical pilot plant—such as a redox flow battery, an electrowinning cell, or a chlor-alkali membrane reactor—the cell is run until thermal, hydraulic, and chemical steady state is reached.
Instrument-grade voltmeters and high-impedance potentiostats then measure the OCV with minimal current draw.
That measured value, after correcting for any non-idealities, becomes the foundation for computing (\Delta G) and (K) for the reaction as it would behave at production scale.
Validating the Equilibrium Constant Directly
Because (K^\circ) is exponentially related to (E^\circ), even small shifts in measured voltage reveal large changes in equilibrium composition.
In a pilot plant, operators can deliberately alter one reactant’s concentration and track the corresponding OCV change.
Plotting the Nernst slope—observed voltage versus (\log Q)—confirms whether the measured slope matches the theoretical (0.0591/n), thereby validating that the cell indeed reaches a true thermodynamic equilibrium and that the derived (K^\circ) is correct.
Extending the Verification with Temperature Control
Although the 298 K simplification is widely taught, pilot plants routinely incorporate temperature control to prove the broader relationship.
By varying the operating temperature over a range—while maintaining equilibrium—the plant data can test the full expression (\Delta G = -RT \ln K).
Determining the Spontaneity Threshold
Many reactions have enthalpy and entropy changes with the same sign, making spontaneity highly temperature-dependent.
In a pilot-scale electrochemical reactor, ramping the temperature while monitoring OCV reveals the exact point where (\Delta G) crosses from positive to negative.
This experimental determination of the transition temperature directly validates the thermodynamic prediction and provides the data needed to set process conditions for maximum yield.
Corroborating Calorimetric Data
Electrochemical pilot plants often incorporate heat flux sensors or precise thermal control loops.
By measuring the temperature coefficient of the OCV, (\left(\frac{\partial E}{\partial T}\right)_P), one can extract the entropy change (\Delta S) of the cell reaction.
Pairing that with the already-measured (\Delta G) gives the enthalpy change (\Delta H), which can be cross-checked against direct calorimetric heat balances performed on the same pilot unit, creating a powerful closed-loop validation.
Understanding the Trade-offs and Common Pitfalls
Verifying thermodynamic constants through electrochemical measurements is elegant, but the method carries inherent limitations that pilot-plant studies must transparently address. Ignoring them leads to miscalculations that can undermine the entire scale-up rationale.
The Danger of a Non-Equilibrium State
A stable OCV reading does not automatically guarantee thermodynamic equilibrium.
Stray faradaic reactions, slow electrode kinetics, or a mixed potential can produce an apparently steady voltage that does not correspond to the intended main reaction.
Rigorous pilot validation requires confirming that the voltage returns to the same value after a small current pulse, and that the Nernst plot against known concentration changes remains linear with the correct slope.
Activity vs. Concentration: The Ideality Gap
The equation (E^\circ = \frac{0.0591}{n} \log K) assumes unit activity coefficients.
In industrial electrolytes with high ionic strengths or complex speciation, using molar concentrations directly can introduce systematic errors.
Pilot-plant verification therefore often includes a step to empirically determine the formal potential (E^{\circ'}) under actual process conditions, distinguishing the ideal thermodynamic constant from the practical equilibrium quotient.
The 0.0591 Constant is Only for 298 K
This single-temperature simplification is convenient but can mislead if applied to pilot plants running at 60 °C or 80 °C.
The correct Nernst factor changes with temperature ((\frac{RT \ln 10}{F})), and verification across a realistic temperature range requires using the appropriate slope to avoid a biased calculation of (K^\circ).
Pilot plants that overlook this detail risk claiming a larger equilibrium constant than the process can actually deliver at operating temperature.
Making the Right Choice for Your Verification Goal
The way you use a pilot plant to connect voltage to Gibbs free energy depends entirely on what you need the verification to do. Align your approach accordingly.
- If your primary focus is education and demonstrating fundamentals: Use a well-characterized cell chemistry (e.g., the Daniell cell or a simple ferri/ferrocyanide system) in a small-flow pilot rig. Show that the measured OCV at 25 °C matches the calculated (E^\circ) from tables, and let students derive (K^\circ) and (\Delta G^\circ) to reinforce the theory with real industrial instrumentation.
- If your primary focus is process design and scale-up: Measure the formal potential under actual electrolyte compositions and target temperatures. Use the slope of the Nernst plot to confirm that the pilot cell behaves as a true single potential-determining system. The resulting equilibrium constant, even if non-ideal, tells you the maximum achievable conversion for your specific stream.
- If your primary focus is thermal optimization of a new reaction: Run temperature sweep experiments and extract (\Delta S) from the OCV temperature coefficient. Cross-validate the calculated (\Delta H) against direct calorimetry to ensure that the electrochemical model correctly predicts the heat load required to keep the reaction spontaneous in a full-scale plant.
A single open-circuit voltage measurement, captured under the vigilant control of a pilot plant, transforms an abstract equation into a verifiable, actionable design parameter that governs reaction yield and process economics.
Summary Table:
| Parameter | Symbol | Verification Method in Pilot Plants | Industrial Value |
|---|---|---|---|
| Cell Potential | $E^\circ$ | Open-circuit voltage (OCV) measurement at steady state | Defines baseline electrical favorability |
| Gibbs Free Energy | $\Delta G^\circ$ | Calculated via $\Delta G^\circ = -nFE^\circ$ under controlled temp | Predicts reaction spontaneity & transition thresholds |
| Equilibrium Constant | $K^\circ$ | Derived via Nernst slope validation (voltage vs. $\log Q$) | Determines maximum achievable product yield |
Bring Electrochemical Theory to Life with LABPARK
Bridge the gap between thermodynamic equations and industrial scale-up. LABPARK provides state-of-the-art Educational and Vocational Unit Operations Pilot Plants in chemical engineering, bioprocess & biotech, and environmental & water treatment. Engineered specifically for universities, research institutes, and enterprises, our systems allow users to accurately analyze cell potentials, Gibbs free energy, and thermodynamic constants in real-world scenarios.
Ready to upgrade your laboratory or research facility? Contact LABPARK today to find the ideal pilot plant solution for your goals!
Related Products
- Electrochemical Water Treatment Educational Unit Operations Pilot Plant
- Multi Pump Fluid Transport Process Piping Unit Operations Training Pilot Plant
- Multi-Reactor Educational Pilot Plant for Reaction Engineering Unit Operations
- Electrolytic Hydrogen Production Educational Unit Operations Pilot Plant
- Multi-Modal Distillation Unit Operations Training Pilot Plant
People Also Ask
- What design features do educational electrochemical pilot plants utilize to manage gas liberation and water loss?
- How can unit operations pilot plants show lead-acid concentration vs state of charge? Real-time monitoring guide.
- How do educational electrochemical pilot plants scale up electrolysis? Master industrial engineering.
- How to Estimate Sulfate in Water Treatment Pilot Plant Deposits: Gravimetric Guide
- How can foaming be managed during steam generation experiments in water treatment unit operations pilot plants? Tips