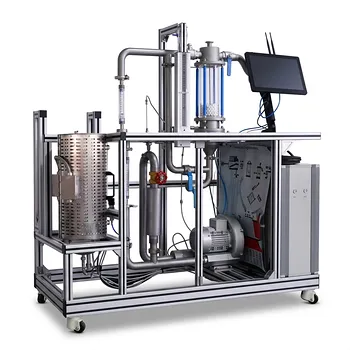
The overall heat transfer coefficient ($U$) in pilot plants is primarily determined by operating the exchanger at a steady state, measuring fluid flow rates and all four terminal temperatures, and solving the heat transfer rate equation $Q = U A \Delta T_m$. The analysis then shifts from a single number to a resistance breakdown, where the measured $U$ is deconstructed into individual convective film coefficients and fouling factors using variations in fluid velocity and properties. This not only confirms the physics but reveals exactly where the limiting thermal barrier lies.
In a heat transfer pilot plant, experimentally measuring $U$ is the starting point. The deeper objective is to transform that raw coefficient into a diagnostic tool—isolating the contributions of tube‑side film, shell‑side film, wall conduction, and fouling deposits so that performance can be predicted, scaled up, and maintained with confidence.
The Experimental Foundation: Measuring Heat Duty and LMTD
Every determination of $U$ in a pilot plant begins with hard data from a running system.
Achieving Steady-State Conditions
The plant must be operated until all temperatures and flow rates stabilize. Transient fluctuations destroy the validity of the heat balance. Only after steady state can the measured values be considered representative.
Calculating Heat Duty ($Q$)
The heat transfer rate is found from a simple energy balance on either the hot or cold fluid: $$Q = \dot{m}h c{p,h} (T_{h,in} - T_{h,out}) = \dot{m}c c{p,c} (T_{c,out} - T_{c,in})$$
Mass flow rates and specific heats are measured or taken from property tables. An energy balance discrepancy below 5% typically confirms good data.
Computing the Log Mean Temperature Difference ($\Delta T_m$)
The driving force for counter‑flow or co‑current exchangers is the log mean temperature difference (LMTD) tailored to the flow arrangement. Once $Q$, the known heat transfer area $A$, and $\Delta T_m$ are available, the experimental $U$ is solved directly: $$U = \frac{Q}{A \cdot \Delta T_m}$$
This single, lumped coefficient is the starting point—but the real learning happens when you pull it apart.
Breaking Down the Resistance: From $U$ to Individual Coefficients
A measured overall coefficient hides a stack of resistances. Pilot plants let you separate them, turning $U$ into a teaching and design tool.
The Thermal Resistance Model
For a tubular exchanger, the overall coefficient based on the outside area ($U_o$) unfolds as:
$$\frac{1}{U_o} = \frac{1}{h_o} + \frac{1}{h_{od}} + \frac{d_o \ln(d_o/d_i)}{2 k_w} + \frac{d_o}{d_i}\frac{1}{h_{id}} + \frac{d_o}{d_i}\frac{1}{h_i}$$
Here, $h_i$ and $h_o$ are the convective film coefficients, $h_{id}$ and $h_{od}$ are the inner and outer fouling resistances, $k_w$ is the tube wall thermal conductivity, and $d_o$, $d_i$ are diameters. Each term can be probed in a well‑instrumented pilot plant.
Isolating Convective Film Coefficients
By varying the flow rate of only one fluid, you change its Reynolds number and thus its film coefficient, while the other resistances stay roughly constant. Plotting $1/U$ against $1/v^n$ (where $n$ comes from the applicable heat transfer correlation) generates a Wilson plot. The y‑intercept gives the sum of all other resistances, while the slope yields the film coefficient of the varied stream.
This method is especially powerful in stirred‑tank reactors. A Wilson plot of $1/U$ versus $n^{-2/3}$ (where $n$ is stirrer speed) extracts the maximum jacket‑side heat transfer coefficient, independent of the solvent used. It provides a clean in‑situ characterization of reactor heat transfer capability.
Quantifying Fouling in Real Time
Fouling factors are never a static number. Pilot plants can run continuously for days, recording $U$ as scale deposits grow. By comparing the “clean” $U$ from start‑up with the decaying $U$ over time, the fouling resistance $R_f = 1/U_{fouled} - 1/U_{clean}$ is calculated directly. This is how realistic cleaning schedules and excess area margins are justified.
Advanced Analysis: When the Heat Transfer Coefficient Refuses to Be Constant
In many pilot operations, fluid properties change dramatically along the exchanger. Assuming a constant $U$ then leads to a dangerously undersized design.
Linear Variation of $U$ with Temperature
If $U$ varies roughly linearly with local temperature, a modified rate equation uses the end‑point local coefficients $K_{o1}$ and $K_{o2}$:
$$Q = A \frac{K_{o1}\Delta t_2 - K_{o2}\Delta t_1}{\ln!\left(\frac{K_{o1}\Delta t_2}{K_{o2}\Delta t_1}\right)}$$
This approach corrects the driving force without requiring a full numerical model.
Non‑Linear Property Changes
When property variations are highly non‑linear—common with heavy oils or near‑critical fluids—the only rigorous path is segmenting the exchanger. The pilot‑plant data is used to divide the heat transfer path into several small sections, treating $U$ as constant in each. Numerical or graphical integration over these differential segments then yields the required area, giving students and engineers a direct feel for the limits of simple methods.
Practical Validation: Empirical Ranges and Solvent Tests
Pilot plants never exist in a vacuum. Empirical checks and solvent‑based tests confirm that measured values are believable.
Reference Ranges for Sanity Checks
Before trusting a new $U$ measurement, it’s compared against well‑known industrial ranges:
- Water‑to‑water: 850–1700 W/(m²·°C)
- Water‑to‑low‑viscosity hydrocarbons: 300–850 W/(m²·°C)
- Water‑to‑gas: 17–280 W/(m²·°C)
A pilot‑plant value far outside the expected range immediately flags measurement errors or unexpected fouling.
UA Characterization in Reactors
For jacketed reactors without a reaction, a solvent test is the gold standard. The vessel is filled to the rated volume, agitation is set to the process speed, and a heating/cooling step is applied. Transient jacket and pot temperatures are fitted to energy balances to extract the $UA$ product. This single number determines whether the pilot reactor can safely manage the heat released by the intended chemistry—a critical scale‑up gate.
Understanding the Trade‑offs
No single approach to determining $U$ is perfect. Each brings a set of compromises you must manage.
Experimental Accuracy vs. Effort
The direct $Q = U A \Delta T_m$ method is simple but lumps all uncertainties into one number. A 2% error in flow measurement can cause a 5% swing in $U$. Achieving ±1% accuracy demands high‑precision instrumentation and meticulous steady‑state control, which increases pilot‑plant cost and run time.
Wilson Plot Assumptions
The Wilson plot requires that only the varied stream’s film resistance changes. In practice, changing one fluid’s flow rate can shift the other film coefficient through minor temperature‐property interactions. The method also assumes a known exponent in the Nusselt‑Reynolds correlation; if the wrong exponent is used, the extracted resistances are skewed.
Fouling Interpretation Is Path‑Dependent
Fouling is often treated as a simple added resistance, but its time‑dependent, non‑uniform nature means a single $R_f$ value measured today may not hold tomorrow. Pilot‑plant log data must be coupled with trend analysis to forecast fouling rates, not just record a snapshot.
Variable $U$ Techniques Add Complexity
Segmenting the exchanger or using modified LMTD expressions requires detailed property data and often iterative calculations. The gain in accuracy is real, but the analytical burden can obscure the main pedagogical message in an educational pilot plant. Simpler methods should be taught first, with the advanced corrections introduced only when the data clearly shows a breakdown.
Making the Right Choice for Your Goal
The “best” way to determine and analyze $U$ depends entirely on why you’re running the pilot plant.
- If your primary focus is education and fundamental understanding: Start with the steady‑state $Q = U A \Delta T_m$ measurement, then perform Wilson plots to isolate film coefficients. Use clean fluids first, then intentionally foul one side to demonstrate the resistance‑in‑series concept visually.
- If your primary focus is scale‑up of a new process: Conduct solvent‑free UA tests in the reactor and run the full‑scale pilot exchanger with the actual fluids across the expected flow range. Segment the exchanger if property variation exceeds 20%. Always log fouling over a multi‑day run to define a realistic fouling allowance.
- If your primary focus is troubleshooting an existing unit: Measure $U$ at several flow rates and compare the resistance breakdown against the design specification. The largest resistance term tells you where to focus your cleaning or redesign effort—no guesswork needed.
- If your primary focus is validating a heat exchanger design code: Generate a clean $U$ curve over a wide Reynolds number range and use the Wilson plot to extract pure film coefficients. Feed those coefficients back into your model to confirm the built‑in correlations match your physical system.
Ultimately, the overall heat transfer coefficient in a pilot plant is never just a number—it is a window into the physics of thermal resistance that gives you the power to design, scale, and troubleshoot with precision.
Summary Table:
| Analysis Method | Key Formula/Parameter | Primary Application |
|---|---|---|
| Steady-State LMTD | $Q = U A \Delta T_m$ | Measuring overall heat duty and initial $U$ |
| Wilson Plot | $1/U$ vs. $1/v^n$ | Isolating individual convective film coefficients |
| Fouling Analysis | $R_f = 1/U_{fouled} - 1/U_{clean}$ | Quantifying scale buildup and cleaning schedules |
| Segmented Integration | Differential segments | Modeling systems with non-linear fluid properties |
Are you looking to optimize your chemical engineering training or scale up thermal processes? LABPARK provides high-quality Educational and Vocational Unit Operations Pilot Plants in chemical engineering, bioprocess & biotech, and environmental & water treatment. Designed specifically for universities, research institutes, and enterprises, our pilot plants deliver the precise instrumentation and control needed to master heat transfer coefficients, fluid dynamics, and process scale-up.
Ready to elevate your research and teaching capabilities? Contact LABPARK today to find the perfect pilot plant solution for your laboratory!
Related Products
- Comprehensive Multi-Modal Heat Transfer Unit Operations Pilot Plant for Engineering Training
- Three-Tube Heat Transfer Educational Pilot Plant for Unit Operations Training
- Dual Mode Heat Transfer Pilot Plant for Unit Operations Training
- Comprehensive Heat Transfer Coefficient Determination Educational Unit Operations Pilot Plant
- Shell and Tube Heat Exchanger Heat Transfer Coefficient Determination Educational Pilot Plant
People Also Ask
- Why is the study of thermal boundary layers and Prandtl numbers critical in heat transfer unit operations pilot plants?
- When is ε-NTU preferred over LMTD in pilot plants? Predict heat exchanger performance without iteration.
- How does transitioning to a multi-shell heat exchanger affect required area? Optimize pilot plant design.
- How is the effective thermal conductivity of a dilute particle suspension calculated? A Pilot Plant Guide
- Why is emissivity critical in heat transfer pilot plants? Bridge the Gap Between Theory & Industrial Design