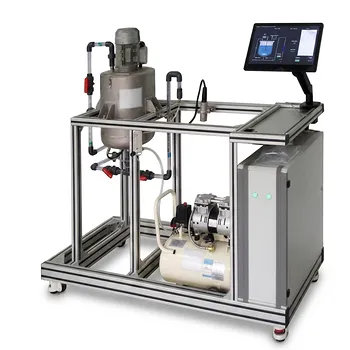
FBRM is the difference between running a mill blind and watching it think. In pilot-scale dry granulation and milling, Focused Beam Reflectance Measurement is utilized as an in-line analytical tool that provides continuous, real-time particle size trends by directly measuring particle chord lengths in the process stream. Instead of waiting for offline lab results, you insert a spinning laser probe into the mill’s output to instantly see how the size distribution shifts with every parameter change.
Real-time particle characterization with FBRM turns a static milling step into a transparent, dynamic process. It solves the deep need to instantly correlate mill settings with particle quality, enabling faster development, detecting screen wear early, and eliminating the guesswork inherent in grab sampling.
The Foundation: How FBRM Works in a Milling Stream
The technology might sound complex, but its application in pilot-scale milling follows a straightforward mechanical principle.
The Spinning Laser and the Output Stream
An FBRM probe is inserted directly into the product flow leaving the mill. A laser beam inside the probe rotates at a high speed. When that beam hits a particle as it passes by the sapphire window, light is reflected back.
Timing Light, Not Taking Pictures
The instrument does not try to measure the full particle shape. It measures the duration of the backscattered light pulse. Because the laser’s rotational velocity is known, the system multiplies time by speed to calculate a “chord length” for each particle. Thousands of these chord lengths are measured every second, building a robust, real-time distribution.
From Chord Length to Process Insight
The output is a chord length distribution (CLD), not a perfect equivalent of sieve size. However, the trend in the CLD correlates directly with changes in the true particle size distribution. For pilot-plant and university lab users, this means you see the mill’s performance shift dynamically without ever taking a manual sample.
The Real Need: Why Real-Time Data Transforms Pilot-Scale Milling
The surface utility is obvious, but the deep value lies in solving the chronic problems of analytical delays and process blindness during development.
Escaping the Trap of Manual Sampling
Traditional characterization requires stopping the process, taking a sample, and sending it to the lab. That time lag prevents you from understanding transient events. In contrast, FBRM puts you inside the process moment by moment, revealing exactly how the mill reacts to changes in feed rate, rotor speed, or screen type.
Watching Screen Condition, Not Guessing
Screen wear or blinding is a silent process killer. With a continuous particle size trend, you can see the distribution drift the instant a screen starts to degrade. This direct observation allows students and researchers to study wear mechanisms and schedule maintenance based on actual performance, not fixed intervals.
Accelerating Development Cycles
Pilot plant work is about defining a robust design space. FBRM provides the dense, real-time data needed to build statistically meaningful models in a fraction of the time. You can run a Design of Experiments and see the particle size response surface emerge on the screen in real time.
The Operational Window: What FBRM Reveals
Once the probe is installed, the raw chord length data translates into specific, actionable process signatures.
The Movement of the Mean
Watching the mean chord length trend line is your primary indicator. A stable line suggests a consistent milling operation. A sudden shift, without a deliberate parameter change, is an early warning of feed variation or equipment trouble.
The Shape of the Distribution
Beyond the average, the width and fine/coarse tails of the chord length distribution matter. A growing coarse tail might indicate bypass through a damaged screen. An expanding fine tail could point to over-milling and energy waste, which directly impacts downstream flow and compression characteristics.
Transient Response to Controls
When you intentionally change the mill’s impeller speed, FBRM shows you the transition curve from the old steady state to the new one. This dynamic response time, often missed by grab samples, quantifies how quickly the mill equilibrates and helps you avoid collecting off-spec material during start-up or changes.
Understanding the Limitations
Trust is built on objectivity. FBRM is powerful, but it is not a universal solution and must be used with a clear understanding of its constraints.
Chord Length Is Not Particle Size
The measurement is fundamentally a chord, a random line segment through a particle. It will always be smaller than, for example, the sieve diameter of an irregular granule. The CLD is a robust process fingerprint, but it cannot be directly inserted into a traditional particle size specification without a validated correlation model.
Sensitivity to Particulate Density and Flow
The probe requires a consistent stream of particles across its window. Low-density materials, highly aerated flows, or sticky substances can lead to measurement noise or window fouling. In a pilot plant, ensuring the probe is installed in a location with good, representative flow of the product is critical for reliable data.
A Statistical Fingerprint, Not a Microscopy Replacement
FBRM excels at trend analysis and relative changes. It does not provide the morphological detail (surface texture, shape) that a microscope does. Its strength is in the continuous generation of a statistically powerful numerate rate for process control, not in capturing a single high-resolution image of a particle.
Making the Right Choice for Your Development Goal
Integrating FBRM into a pilot-scale milling operation is a strategic decision, not just an equipment purchase. Your primary objective should dictate how you deploy and interpret the data.
- If your primary focus is process optimization and scale-up: Use the real-time mean chord length trend to quickly map out the operational window for a new formulation. The immediate feedback lets you nail down target parameters in days, not weeks.
- If your primary focus is equipment and screen life analysis: Monitor the fine-to-coarse ratio trend over long-duration runs. A change in this ratio over time, without a change in setpoints, is your most reliable indicator of progressive screen wear.
- If your primary focus is quality-by-design and regulatory filing: Treat the FBRM signal as a critical process attribute (CPA) fingerprint. Build a chemometric model linking the chord length distribution to a primary offline measurement (like sieve size) and use it to demonstrate real-time detection of process faults.
- If your primary focus is fundamental research and teaching: Exploit the dynamic data to show students how milling theory (like specific energy input) translates into physical reality, making abstract concepts of breakage and population balance models instantly visible.
The tool’s ultimate value is not in the chord length number itself, but in your ability to tie its sensitive, real-time signature to a specific, meaningful outcome for your product or process.
Summary Table:
| Feature | FBRM (In-line) | Traditional Offline Sampling |
|---|---|---|
| Measurement Speed | Real-time (seconds) | Hours/Days delay |
| Data Type | Chord Length Distribution (CLD) | Sieve / Laser diffraction size |
| Process Impact | Continuous monitoring, prevents waste | Reactive adjustments only |
| Screen Wear Detection | Instant detection of degradation | Detected only after batch completion |
| Ideal For | Dynamic process optimization & scale-up | Final quality control verification |
Elevate Your Process Research and Training with LABPARK
Are you looking to bridge the gap between classroom theory and industrial application? LABPARK provides premium Educational and Vocational Unit Operations Pilot Plants in chemical engineering, bioprocess & biotech, and environmental & water treatment.
Engineered specifically for universities, research institutes, and enterprises, our pilot systems allow you to integrate advanced technologies like real-time monitoring to accelerate development and train the next generation of engineers.
Contact LABPARK today to discover how our customized pilot plant solutions can enhance your research and educational capabilities!
Related Products
- Continuous Sieve-Plate Distillation Pilot Plant for Unit Operations Laboratory Education
- Agitation and Mixing Educational Unit Operations Pilot Plant
- Multi-Functional Drying Educational Unit Operations Pilot Plant
- Multi-Modal Distillation Unit Operations Training Pilot Plant
- General Purpose Cosmetics Production Unit Operations Training Pilot Plant
People Also Ask
- How do distillation pilot plants validate VLE data? Achieve reliable solvent separation scale-up.
- How does catalyst water concentration affect distillation pilot plant design? Key separation train choices.
- Why is vacuum operation capability an essential feature for a distillation unit operations pilot plant? Unlock Efficiency
- Why is condensate subcooling critical in pilot plants? Expert Design & Control Guide
- How to select the right activity coefficient model (Wilson, NRTL, UNIQUAC) for distillation pilot plants?