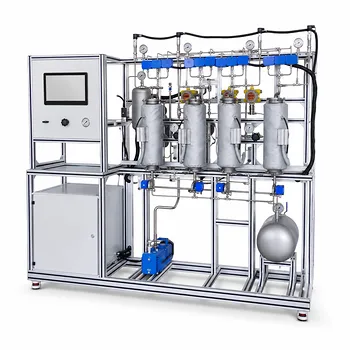
The pressure drop across an absorption tower's packing is a direct, measurable consequence of gas velocity and packing resistance. Chemical and environmental pilot plants demonstrate this by allowing precise control of gas flow rates while using differential pressure manometers to record the resulting pressure drop. Students can then map the characteristic S-shaped curve, visually identify the loading and flooding points, and calculate the blower power required to overcome the bed's resistance—all while manipulating the very variables that define industrial column design.
The core insight: A pilot plant turns abstract equations into a tangible system where increasing gas flow rate raises pressure drop first linearly, then exponentially as the bed loads and floods. The packing's physical geometry and arrangement—its resistance—determine the steepness of this curve and the operating window's limits. By experimenting with different packings and flow rates, engineers directly observe how resistance parameters dictate energy consumption and column capacity.
How Pilot Plants Visualize the Pressure Drop–Flow Rate Relationship
The central experiment is elegantly simple: air from a blower passes through a column filled with standard industrial packing, while a manometer measures the pressure difference across the bed. A gas flow regulator lets you step through increasing superficial velocities.
Creating the Characteristic Curve
A U-tube or digital differential pressure manometer reads the dry packing pressure drop at each flow rate. Plotting log pressure drop versus log gas velocity yields a curve that starts with a straight line at low velocities—this region follows the Ergun equation and represents purely frictional loss.
As velocity rises, the curve bends upward. This inflection is the loading point, where liquid holdup begins to significantly constrict the void space.
A further small increase in gas rate sends pressure drop skyrocketing near-vertically. That is the flooding point, and the pilot plant lets you safely enter this regime to see the catastrophic loss of capacity. Industrial columns are designed to operate at about 80% of the flooding velocity, with a typical design pressure drop of 15 to 80 mm H₂O per meter of packing.
Connecting to Blower Power
The measured pressure drop directly translates into the blower's power requirement. By running the pilot plant at different operating points, students calculate how a higher gas throughput or a tighter packing increases the energy needed to move the gas. This makes the cost of over-designing or under-designing the tower tangible.
The Role of Packing Resistance
Packing geometry is not a minor detail—it is the dominant factor in the pressure drop relationship. Pilot plants equipped with interchangeable packings allow side-by-side comparison of resistance parameters.
Geometric Influence: Stacked vs. Dumped
Stacking packings in an ordered, structured way dramatically lowers resistance compared to randomly dumping the same nominal size. For example, a ½‑inch packing dumped yields a pressure drop parameter (h₂) of 0.340, while the same packing stacked shows a parameter of only 0.039.
Pilot plant runs make this difference visible: at identical gas and liquid loads, the stacked bed produces a much flatter pressure drop curve and a higher flooding velocity.
The Effect of Nominal Diameter
Smaller packings such as 3/8‑inch Raschig rings pack more surface area but create higher resistance. Their resistance parameter (h₁) can reach 7.39, meaning the pressure drop rises far more quickly with gas velocity than for larger, more open packings.
By swapping between different diameters in the same pilot plant, students can see how a smaller packing forces the loading and flooding points to occur at lower gas rates. This directly teaches the trade-off between mass transfer efficiency and pressure drop.
From Dry Packing to Operating Column: The Influence of Liquid Flow
Once liquid is introduced, the pressure drop story changes because the liquid occupies part of the void space.
Liquid Holdup and the Active Void
In a wet bed, gas velocity pushes against both the dry packing resistance and the liquid film clinging to the surfaces. The effective porosity becomes the dry porosity minus the liquid holdup. As gas flow increases, the holdup grows, narrowing the passage for gas and causing the pressure drop to accelerate.
Pilot plants let you fix the liquid rate and then ramp up the gas, directly observing how the loading point appears earlier when the solvent flow is high. This is the physical basis of the generalized pressure drop correlation used in industrial design.
Demonstrating the Absorption Parameter Link
Though not strictly a pressure drop experiment, varying the L/G ratio shows the indirect effect. A higher solvent flow (L) increases holdup, shifting the loading and flooding points to lower gas velocities. The same pilot plant used for pressure drop studies can therefore also verify that the optimal absorption parameter mGₘ/Lₘ should fall between 0.7 and 0.8—a condition that balances mass transfer driving force against excessive pressure drop and potential flooding.
Understanding the Trade-offs
Operating a column exactly at the point of highest mass transfer comes with risk and cost. The pilot plant makes these trade-offs painfully clear.
- Energy cost vs. throughput: A tighter, more efficient packing drives up pressure drop fast. The blower power escalates, and at industrial scale this is a major operating expense.
- Stability near flooding: Running close to the flooding point maximizes capacity but leaves no margin for flow disturbances. A small surge in gas or liquid rate can flood the column, causing a drastic loss of separation and potential damage. The pilot plant's pressure drop spike dramatizes this instability.
- Packing robustness: Stacked packings offer low resistance but may be more sensitive to liquid maldistribution. Dumped packings are forgiving but raise pressure drop. The experiment lets you weigh these practical design choices.
Making the Right Choice for Your Experiment or Plant
A pilot plant is not just a teaching tool—it generates data that directly informs scale-up. Your focus determines which experiment to run and what parameter to prioritize.
- If your primary focus is energy efficiency: Select the packing with the lowest resistance parameter (stacked, large diameter) and map the pressure drop curve to identify the maximum gas velocity that still keeps ΔP below 15–20 mm H₂O/m. This minimizes blower power.
- If your primary focus is maximum mass transfer in a compact column: Choose a small-diameter dumped packing and operate just at the onset of loading (80% of flooding velocity). Use the pilot plant to confirm the exact velocity and the corresponding pressure drop so you can size the blower correctly.
- If your primary focus is operational safety and turndown: Generate a full loading/flooding curve for your chosen packing at the design liquid rate. Identify the flooding velocity and set your maximum operating point with a clear safety margin. This prevents surging and column upsets in production.
- If your primary focus is solvent regeneration: Run the column at higher temperature and reduced pressure to strip gas. The pressure drop behavior remains relevant because you still need to move stripping gas through the packing, but these conditions will shift the equilibrium and require re-evaluation of the flooding point.
The physical relationship between gas flow, pressure drop, and packing resistance is not just theory—it is the quantifiable heartbeat of every absorption tower, and the pilot plant lets you feel that pulse directly.
Summary Table:
| Parameter | Physical Effect | Design & Operational Impact |
|---|---|---|
| Gas Velocity | Increases pressure drop linearly, then exponentially | Determines loading/flooding limits and blower power requirements |
| Packing Geometry | Stacked packing has significantly lower resistance than dumped | Flatters the pressure drop curve and allows higher gas flow rates |
| Nominal Diameter | Smaller packings provide more surface area but increase resistance | Trades mass transfer efficiency for higher operational pressure drop |
| Liquid Flow (L/G Ratio) | High liquid rate increases holdup, constricting void space | Shifts loading and flooding points to lower gas velocities |
Bring Industrial Scale-Up into Your Laboratory
Bridging the gap between chemical engineering theory and practical column design requires hands-on, reliable experimental data. LABPARK provides state-of-the-art Educational and Vocational Unit Operations Pilot Plants in chemical engineering, bioprocess & biotech, and environmental & water treatment.
Specifically engineered for universities, research institutes, and enterprises, our pilot plants enable students and researchers to master gas absorption, pressure drop analysis, and packing optimization in a safe, controlled environment.
Ready to elevate your training and research capabilities? Contact LABPARK today to find the perfect pilot plant solution for your lab.
Related Products
- Packed Bed Absorption Educational Unit Operations Pilot Plant
- Multi-Component Gas Pressure Swing Adsorption Pilot Plant for Unit Operations Education
- Absorption and Desorption Educational Unit Operations Pilot Plant
- Dual-Mode Gas Absorption and Desorption Unit Operations Training Pilot Plant
- Carbon Dioxide Absorption and Desorption Educational Pilot Plant for Carbon Capture Studies
People Also Ask
- How Do Flow Regimes Transition in Packed Bed Pilot Plants? Key Scale-up Insights
- How does reactant concentration determine absorption column control? Gas-film vs. dual-film.
- How is the packing height of an absorption column calculated? Master HTU & NTU Concepts
- How does static vs. operating holdup affect pilot plant calibration? Avoid Critical Scale-Up Errors
- Why is counter-current flow selected for gas absorption? Maximize Pilot Plant Efficiency