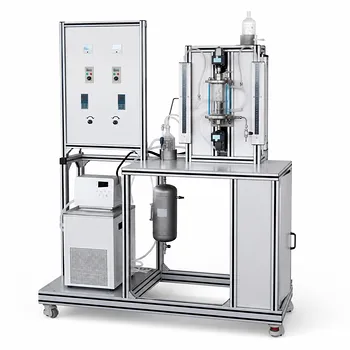
Direct observation in a transparent pilot plant is the most reliable way to connect textbook flow regimes to real-world behavior. Chemical engineering students can visually identify distinct two‑phase gas–liquid flow patterns by manipulating gas and liquid flow rates in a fluid‑dynamics unit‑operations pilot plant equipped with vertical and horizontal transparent test sections. In vertical upward flow, they sequentially observe bubble, slug, churn, wispy annular, and annular flow. In horizontal sections, gravity creates stratified, wavy, and slug patterns. These visual identifications are then experimentally validated by correlating them with quantitative pressure‑drop measurements, turning a qualitative observation into an engineering design parameter.
Two‑phase flow patterns aren’t abstract diagrams—they are reproducible physical states that students can control, see, and measure. The pilot plant becomes a living flow‑pattern map where manipulating flow rates reveals both the visual signature of each regime and its associated pressure‑drop signature, directly linking lab experience to industrial piping and reactor design.
The Power of Transparent Pilot Plants
Manipulating Flow Rates to Create Regimes
A fluid‑dynamics pilot plant lets students independently set the gas and liquid flow rates. By starting with a low gas‑flow and gradually increasing it while holding the liquid‑rate constant, students drive the flow through a sequence of distinct regimes. This systematic sweep is the experimental heartbeat of flow‑pattern identification.
Visual Identification of Vertical Upward Flow Patterns
The transparent vertical test section makes the five primary regimes unmistakable.
- Bubble flow – Uniformly distributed small gas bubbles rise through a continuous liquid phase. The visual impression is like a swarm of tiny, evenly spaced spheres.
- Slug flow – Large, bullet‑shaped gas pockets that nearly fill the tube cross‑section pass periodically, separated by liquid slugs. The gas–liquid interfaces are clearly visible and the flow is intermittent.
- Churn (chaotic) flow – A highly turbulent, disordered state where macroscopic gas plugs break down. The visual becomes a roiling mixture of liquid and gas with no clear regularity—both dispersed bubbles and irregular gas pockets coexist.
- Wispy annular flow – A thick liquid film clings to the tube wall while the central gas core contains elongated, streaky liquid droplets. It looks like a “wispy” transition between churn and full annular flow.
- Annular flow – A thin, fast‑moving liquid film surrounds a continuous gas core that carries only a few small suspended droplets. The central core appears relatively clear, with the film shimmering along the wall.
Horizontal Flow: How Gravity Shapes Patterns
In a horizontal test section, gravity forces the heavier liquid to the bottom, creating asymmetric patterns.
- Stratified flow – At low gas and liquid rates, the phases are almost completely separated, with a smooth liquid layer flowing under a gas stream.
- Wavy flow – Increasing gas velocity ripples the liquid surface, producing clearly visible waves at the interface.
- Slug flow – Further increasing gas rate generates periodic liquid slugs that completely fill the pipe cross‑section, sloshing violently as they pass.
Beyond Visuals: Correlating with Pressure Drop
Why Pressure Drop Tells the Story
Each flow regime produces a unique pressure‑drop signature along the test section. As gas velocity rises, the frictional and gravitational pressure losses change distinctly at the transition points. By measuring differential pressure across the transparent tube and plotting it against the superficial gas velocity, students obtain a quantitative fingerprint that matches the visual regime change.
Building a Flow Pattern Map
Students can use the pilot plant to construct their own flow‑pattern map—a graph of superficial liquid velocity versus superficial gas velocity—by marking where each transition occurs visually and confirming it against the pressure drop data. This map is the same engineering tool used to size industrial two‑phase lines and to predict conditions that risk damaging slugging or inefficient annular flow.
Why This Hands‑On Experience Matters
The deep need behind identifying flow patterns is not just academic recall; it’s the ability to predict system performance. Slug flow can cause water hammer and mechanical vibration in plant piping. Churn flow drastically reduces mass‑transfer efficiency in gas‑liquid reactors. Annular flow can lead to dryout in heated tubes. By physically generating these regimes and correlating them with pressure drop, students internalize the cause‑and‑effect relationships that drive safe, efficient equipment design.
Common Pitfalls and Trade‑offs
Subjectivity of Visual Judgment
Visual identification alone can be ambiguous—especially in the churn‑to‑annular transition. Students may disagree on where one regime ends and the next begins. This is precisely why pressure‑drop measurements are essential; they provide an objective threshold.
Transient Effects and Hysteresis
When flow rates are changed quickly, the pattern may not settle immediately. Students must wait for hydrodynamic equilibrium to avoid misidentifying a temporary transitional state as a stable regime.
Wall Wetting and Optical Clarity
Liquid films can obscure the view, especially in annular flow. High‑speed cameras or backlighting can mitigate this, but the pilot plant’s simple transparency works best when the liquid is clear and flow rates are scanned slowly.
Measurement Location Matters
Pressure taps must be placed far enough from bends or valves to capture fully developed flow. Students should be taught to verify this, or they may misinterpret entrance effects as flow‑regime pressure drops.
How to Maximize Learning in the Lab
Every student’s goal in the pilot‑plant session can differ slightly. Tailor your approach accordingly.
- If your primary focus is mastering flow‑pattern recognition: Slowly sweep the gas flow rate at a fixed liquid rate, sketch what you see at each step, and label the transitions before consulting the pressure‑drop data.
- If your primary focus is connecting to design equations: Use the measured pressure drop to validate the theoretical pressure‑gradient model for your observed regime (e.g., the Lockhart‑Martinelli correlation) and identify the regime boundaries on your own flow map.
- If your primary focus is troubleshooting industrial problems: Deliberately create slug flow in the pilot plant, measure the associated pressure pulsations, and then explore how a small change in flow rate can move the system into a more stable regime.
By turning the transparent test section into a living flow‑pattern map, you move from memorization to genuine engineering intuition—one that stays with you when you face the opaque steel pipes of real plants.
Summary Table:
| Flow Pattern | Pipe Orientation | Key Visual Features | Pressure Drop Signature |
|---|---|---|---|
| Bubble | Vertical | Small, uniform bubbles rising in liquid | Low and stable |
| Slug | Vert. & Horiz. | Large gas pockets / periodic liquid slugs | Highly fluctuating / pulsing |
| Churn | Vertical | Chaotic, turbulent mixture of liquid & gas | High and irregular |
| Annular | Vertical | Liquid film on walls, clear gas core | High and stable |
| Stratified | Horizontal | Smooth, separate liquid & gas layers | Very low |
| Wavy | Horizontal | Ripples and waves at the interface | Moderate |
Bring Fluid Dynamics to Life with LABPARK
Bridge the gap between textbook theory and real-world behavior. LABPARK provides state-of-the-art Educational and Vocational Unit Operations Pilot Plants in chemical engineering, bioprocess & biotech, and environmental & water treatment for universities, research institutes, and enterprises.
With our high-quality transparent test sections and integrated instrumentation, you can help students confidently identify flow patterns, build accurate flow maps, and master industrial scale-up.
Contact LABPARK today to elevate your lab training!
Related Products
- Two Phase Flow Pattern Velocity Resistance Measurement Educational Pilot Plant
- Two-Dimensional Fluidization Hydrodynamics Educational Pilot Plant for Unit Operations Training
- Dual-Drive Stirred Gas-Liquid Mass Transfer Coefficient Determination Pilot Plant
- Gas Phase Mixing and Residence Time Distribution Determination Educational Unit Operations Pilot Plant
- Fluid Transport and Piping Dynamics Practical Training Unit Operations Pilot Plant
People Also Ask
- How to update chemometric calibration models in pilot plants? Best practices for process engineers.
- Why Correct Sig Figs & Rounding Matter in Educational Pilot Plants: Ensure Data Accuracy
- How does nuclear yield inefficiency translate to chemical engineering education? Optimize kinetics with pilot plants.
- How can educational pilot plants be used to teach process safety and risk assessment in chemical engineering curricula?
- Why are the laws of similitude critical in fluid flow pilot plants? Scale Up Safely