The conflict between maximizing specific energy and specific power is inevitable at the plate level—but pilot-scale experiments turn it into a solvable engineering problem.
By building and testing scaled-down cells, you can directly measure how grid mass, separator resistance, and current distribution affect both capacity and rate capability. The careful data collected allows you to pinpoint the intermediate grid weight that delivers the right balance of energy and power for your application, using empirical correlations instead of abstract trade-offs.
The core solution is not to avoid the trade-off but to precisely measure it. Pilot-scale studies provide the empirical data needed to select the grid weight where the incremental gain in power delivery is worth the corresponding loss in energy capacity, giving you a battery design validated against real-world constraints.
The Fundamental Conflict Between Specific Energy and Specific Power
Why More Conductive Grids Hurt Energy Capacity
Adding conducting grid mass improves the electrical conductance of the plate, which boosts specific power.
But every gram of grid material displaces active material from the electrode bed.
The active area available for electrochemical reactions shrinks—cutting into the cell’s specific energy.
This is the classic zero-sum game: you sacrifice capacity for rate performance.
The Search for the Optimal Balance Point
Maximizing both metrics at the same time is impossible without a compromise.
The goal becomes finding a grid weight where the ratio of peak power to peak energy matches your design targets.
Theory alone cannot fully predict that optimum, because real packaging, electrolyte, and separator losses skew the numbers dramatically.
How Pilot-Scale Studies Turn Theory into Actionable Data
Building Real Cells to Measure Packaging Penalties
Theoretical specific energy calculations ignore containers, separators, and current collectors.
In practice, these “dead weight” components typically slash actual energy density to 25% to 30% of the theoretical value.
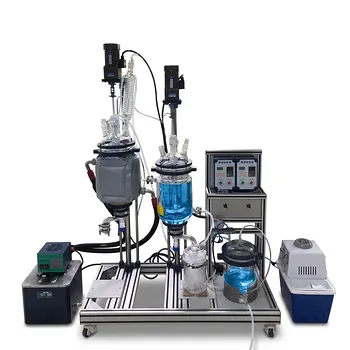
A chemical engineering pilot plant lets you assemble electrodes, separators, and interconnects at a scale that faithfully captures those penalties.
By weighing and testing each build, you generate a true map of mass versus performance—not an idealized model.
Mapping Polarization and Separator Resistance
When you run a discharge test on a pilot cell, you can measure the voltage drop caused by electrolyte resistance and separator resistance.
That resistance, ( R_s ), directly reduces the effective electrochemical conductance of the plate.
Pilot studies allow you to vary plate geometry and grid weight while holding other components fixed, isolating the conductance changes you need to optimize.
You also collect depth-of-discharge profiles at multiple rates (e.g., a 4‑hour discharge) to see exactly where the cell hits its cutoff potential.
The Step-by-Step Optimization Workflow on a Pilot Plant
Varying Grid Weight and Measuring Discharge Curves
You begin by fabricating several plates with different grid distributions and masses.
Each design is run through a standardized discharge test while recording potential over time.
These curves reveal how average depth of discharge shifts as grid weight changes, directly linking mass to usable capacity at your target rate.
Correcting Conductance with Separator Resistance
Raw plate conductance, ( AY_0 ), is deceptive without accounting for separator losses.
Pilot data lets you correct the electrochemical conductance by subtracting the measured ( R_s ), yielding the effective conductance that drives real power delivery.
This correction is essential for predicting how power scales when you change plate area or grid weight.
Deriving Scale-Up Correlations to Pinpoint the Optimum
With multiple data points in hand, you fit scale-up correlation curves that relate grid weight, plate area, and performance.
A well-known scaling rule emerges: the optimum grid weight tends to scale with plate area to the power of ( A^{3/2} ).
These experimentally validated curves are then used to select the grid weight where the improvement in power per added gram no longer justifies the energy loss.
That precise knee point becomes your optimized design—resolved through pilot-scale experimentation.
Understanding the Trade-offs and Practical Limitations
The Price of Practicality: Added Weight and Measurement Noise
Even pilot cells carry packaging weight that distorts the pure electrode-level trade-off.
You must budget for bus bars, posts, and terminals when interpreting results, as they introduce additional voltage drops and mass penalties.
Measurement variability—especially in electrolyte conductivity estimates—can also shift the apparent optimum, requiring careful experimental control.
Scaling Risks from Pilot to Production
A design that balances energy and power perfectly at pilot scale may still struggle at full scale.
Thermal management, non-uniform current distribution, and manufacturing tolerances all grow with size.
Pilot studies provide the core trend lines, but the final scale-up step always demands a margin of safety and further verification.
Making the Right Choice for Your Battery Design
- If your primary focus is maximizing specific energy for long-discharge applications: Accept lower specific power and minimize grid mass. Your pilot data should guide you toward the lightest grid that still meets your rate requirement.
- If your primary focus is maximizing specific power for high-rate, pulse-based loads: Invest in more conductive grid material, even though it reduces energy capacity. Pilot testing will show where the power gain plateaus, preventing wasteful over-design.
- If your primary focus is a balanced design for mixed duty cycles: Use pilot-scale experiments to locate the grid weight where the ratio of maximum power to maximum energy aligns with your mission profile. This empirical sweet spot gives you the best compromise without guesswork.
With rigorous pilot-scale studies, the energy‑power conflict transforms from a frustrating trade-off into a precision optimization—something you can measure, model, and reliably solve.
Summary Table:
| Parameter | Impact on Specific Energy | Impact on Specific Power | Optimization Approach |
|---|---|---|---|
| Grid Mass | Decreases (displaces active material) | Increases (improves conductance) | Find intermediate weight using pilot data |
| Separator Resistance | Low direct impact | Decreases (causes voltage drop) | Measure $R_s$ to correct conductance |
| Packaging Weight | Decreases (adds dead weight) | Decreases (adds dead weight) | Build pilot-scale cells to capture real penalties |
Bridge the gap between electrochemical theory and real-world performance. LABPARK provides premium Educational and Vocational Unit Operations Pilot Plants in chemical engineering, bioprocess & biotech, and environmental & water treatment tailored for universities, research institutes, and enterprises. Equip your laboratory with the tools to master scaling, optimization, and practical engineering trade-offs. Contact our experts today to explore our pilot plant solutions!
Related Products
- Dual-Mode Rectification Pilot Plant for Practical Training Unit Operations
- Internal Circulation Gradient Free Catalytic Reaction Educational Pilot Plant
- Educational Unit Operations Pilot Plant for Intraparticle Diffusion Effective Factor Measurement
- Supercritical High-Gravity Flash Evaporation Educational Unit Operations Pilot Plant
- Multi-Stage Stirred Tanks in Series Residence Time Distribution and Mixing Performance Determination Educational Pilot Plant
People Also Ask
- How does polyphosphate hydrolysis affect scale and corrosion in pilot plants? Essential Monitoring Guide
- How do utility requirements influence pilot plant selection? Avoid Costly Lab Integration Mistakes
- How do predictive thermodynamic models integrate into pilot plants? Bridging Theory and Practice
- Why Use Center Points in Process Analyzer Calibration? Key Benefits Explained
- Why Unit Operations Pilot Plants Are Critical for Nanotech Integration: Scale-Up Secrets