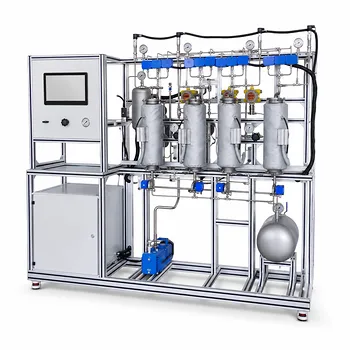
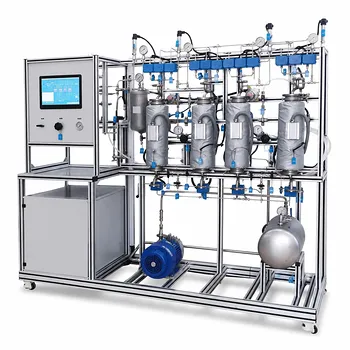
Adsorption thermodynamics and equilibrium isotherms transform raw solute concentration data into a quantitative, predictive map of loading behavior in pilot plant columns. By fitting experimental pairs of stationary-phase solute loading ((q_i)) and mobile-phase concentration ((c_i)) to isotherm models, engineers extract capacity limits and affinity parameters. These constants, when measured at multiple temperatures, feed into the Van’t Hoff equation to deliver the full thermodynamic profile—Gibbs free energy, enthalpy, and entropy—revealing why a separation occurs and how temperature will govern performance.
Understanding solute loading is not just about measuring how much adsorbs—it is about decomposing that measurement into energy contributions that predict column capacity, regeneration cost, and process scalability. Equilibrium isotherms give the experimental map; adsorption thermodynamics converts that map into an engineer’s decision-making compass.
Equilibrium Isotherms: Quantifying Solute Loading from Pilot Plant Data
Pilot plant experiments generate a table of steady‑state concentrations. Fitting these data to a mathematical isotherm is the first step in moving from observation to usable engineering numbers.
Fitting Experimental Data to Langmuir and Freundlich Models
The Langmuir model assumes a homogeneous surface with identical, independent binding sites and a monolayer limit. It yields a maximum adsorption capacity ((q_{max})) and an equilibrium constant (b) that reflects the affinity between solute and adsorbent.
The Freundlich model is an empirical power‑law description, ideal for heterogeneous surfaces and multilayer adsorption, though its parameters lack a strict physical ceiling.
In a typical pilot‑plant exercise, researchers collect liquid‑phase samples at the column outlet until breakthrough. By mass balance, the adsorbent loading at equilibrium is determined for each inlet concentration, giving the set ((c_i, q_i)). Plotting these points and performing non‑linear regression against both equations reveals which model captures the system’s deviation from ideality.
Extracting K parameters That Will Bridge to Thermodynamics
At sufficiently low concentrations—often in the initial linear region of an isotherm—the relationship simplifies to (q_i = K_i , c_i), where (K_i) is the Henry constant. This constant is the gateway to thermodynamic calculations.
Even when data do not fall in a perfectly linear range, the initial slope of the Langmuir equation ((q_{max} b)) can serve as the effective Henry constant. Obtaining (K_i) at several temperatures is what unlocks the energetic story.
Thermodynamic Profiling: From Isotherm Constants to Energetic Insights
Once (K_i) at a given temperature is known, thermodynamics begins. The primary reference defines the molar Gibbs free energy of adsorption as (\Delta G_i = -RT \ln K_i). This single equation transforms a fitted slope into a measure of spontaneity.
The Henry’s Law Regime and Gibbs Free Energy
Gibbs free energy ((\Delta G_i)) answers the question: is the adsorption thermodynamically favored? A negative value signifies that the solute’s chemical potential drops upon binding, driving the separation. In a pilot plant, comparing (\Delta G_i) for different solvents or adsorbents helps rank separation efficiency without building a full‑scale unit.
Small concentrations are essential here because they minimize adsorbate-adsorbate interactions, making the linear idealization valid. The educational pilot plant typically operates in this dilute regime precisely to enable a clean link between column data and fundamental thermodynamics.
Unlocking Enthalpy and Entropy with Van’t Hoff’s Equation
The temperature dependence of (K_i) is exploited via the Van’t Hoff equation:
[ \ln K_i = -\frac{\Delta H_i}{R} \cdot \frac{1}{T} + \frac{\Delta S_i}{R} ]
By plotting (\ln K_i) against (1/T) from isotherm fits at three or more temperatures, the slope yields the adsorption enthalpy ((\Delta H_i)) and the intercept gives the adsorption entropy ((\Delta S_i)).
This step moves the analysis from “it works” to “why it works and how it will behave tomorrow.” An exothermic (\Delta H_i) tells you that raising temperature will reduce capacity—critical for designing a temperature‑swing regeneration cycle. (\Delta S_i) reveals the change in molecular ordering, often reflecting the loss of solvent‑shell entropy when the solute attaches to the surface.
Translating Pilot Plant Insights to Process Decisions
The pilot plant is a miniature decision factory. Thermodynamics and isotherms convert its output into the numbers needed for scale‑up and operation.
Predicting Temperature Effects on Separation Efficiency
With (\Delta H_i) in hand, the change in Henry constant for any new temperature can be estimated using the integrated Van’t Hoff relation. This allows the engineer to anticipate how column capacity, breakthrough time, and even peak elution profiles will shift when the process deviates from the pilot‑plant isothermal condition.
Students and researchers directly test these predictions by varying the column jacket temperature and comparing the observed dynamic binding capacity against the equilibrium‑based forecast. The agreement—or the instructive gap—cements the connection between molecular thermodynamics and unit‑operation performance.
Assessing Adsorbent Capacity and Regeneration Needs
The Langmuir (q_{max}) sets the stoichiometric ceiling for a given adsorbent. Coupled with (\Delta H_i), it defines the energy required per kilogram of solute loaded. In pressure‑swing or temperature‑swing processes, a large exothermic enthalpy means deeper heating is needed to release the solute, directly impacting operating cost.
Freundlich parameters, while empirical, still allow empirical scale‑up through dimensionless number correlations. When a process must handle fluctuating feed concentrations, the exponent (1/n) indicates how loading grows with concentration—flat isotherms ((n) near 1) are more forgiving, while steep ones risk rapid premature breakthrough.
Understanding the Trade-offs: Limitations and Pitfalls
No analysis tool is without its dark corners. Honest pilot plant interpretation means confronting what the models cannot capture.
Model Assumptions vs. Real Pilot Plant Behaviour
The Langmuir model’s assumption of homogeneous, non‑interacting sites rarely holds perfectly. Real adsorbents like activated carbon or resins have a distribution of pore sizes and functional groups, leading to energetic heterogeneity. The Freundlich model fits better but provides no (q_{max}), making it risky to predict absolute capacity beyond the tested concentration range.
Moreover, real pilot‑plant columns can suffer from non‑equilibrium effects—axial dispersion, mass transfer resistances, and channelling—that smear the true isotherm. Using raw breakthrough data without correcting for kinetics can yield an apparent isotherm that under‑ or over‑estimates the true equilibrium loading.
Dealing with Data Scatter and Non‑Idealities
Henry constant determination is extremely sensitive to low‑concentration data quality. Minor errors in measuring trace outlet concentrations propagate into large uncertainty in (\Delta G_i) and (\Delta H_i). Pilot plants must, therefore, be designed with precise analytics and tight temperature control.
Additionally, the isotherm’s linear region may be vanishingly narrow for strong adsorbates, making the direct measurement of (K_i) challenging. In such cases, one must rely on the goodness‑of‑fit of the nonlinear model to infer an effective initial slope, a practice that demands statistical rigor and cross‑validation with multiple isotherm equations.
How to Apply This to Your Pilot Plant Project
The choice of analysis strategy depends on what you need to extract from your solute loading data. Align your approach with the outcome that matters most.
- If your primary focus is Determining Optimal Operating Temperature: Prioritize obtaining Henry constants at 3–4 temperatures to construct a robust Van’t Hoff plot; use the resulting (\Delta H_i) to predict capacity shifts and choose a temperature that balances loading and regeneration ease.
- If your primary focus is Selecting an Appropriate Adsorbent: Fit both Langmuir and Freundlich models to your pilot data; compare (q_{max}) (capacity) and the Langmuir (b) (affinity), and then use (\Delta G_i) as the ultimate arbiter of spontaneity for your target solute.
- If your primary focus is Scaling Up from Pilot to Plant: Extract the thermodynamic parameters ((K_i), (\Delta H_i)) and the maximum capacity; use these as fixed material properties in a process simulator, while reserving mass‑transfer coefficients for separate rate experiments; this decoupling prevents pilot‑plant‑specific kinetics from misleading full‑scale predictions.
- If your primary focus is Educational Demonstration: Keep concentrations in the dilute, linear region to directly measure (K_i) and calculate (\Delta G_i), then deliberately vary temperature to observe the quantitative agreement with the Van’t Hoff prediction—cementing the link between a simple equilibrium isotherm and the fundamental thermodynamics of separation.
When solute loading is seen not as a mere number but as a measurable consequence of molecular‑energy decisions, the pilot plant ceases to be a trial‑and‑error device and becomes a precision diagnostic for the full‑scale world.
Summary Table:
| Model / Parameter | Physical Meaning | Key Application in Pilot Plants |
|---|---|---|
| Langmuir Model | Homogeneous monolayer adsorption | Determines maximum capacity ($q_{max}$) & affinity ($b$) |
| Freundlich Model | Heterogeneous multilayer adsorption | Evaluates empirical loading behavior under fluctuations |
| Gibbs Free Energy ($\Delta G$) | Spontaneity of adsorption | Ranks separation efficiency of adsorbents/solvents |
| Enthalpy ($\Delta H$) | Heat of adsorption (via Van 't Hoff) | Predicts temperature effects & regeneration energy needs |
Optimize Your Pilot Plant Column Design with LABPARK
Are you looking to scale up your separation processes or enhance university laboratory training? LABPARK provides state-of-the-art Educational and Vocational Unit Operations Pilot Plants in chemical engineering, bioprocess & biotech, and environmental & water treatment. Designed specifically for universities, research institutes, and enterprises, our pilot systems empower you to accurately analyze solute loading, study adsorption isotherms, and master thermodynamic profiling.
Ready to elevate your research and teaching capabilities? Contact us today to request a quote or custom consultation!
Related Products
- Packed Bed Absorption Educational Unit Operations Pilot Plant
- Absorption and Desorption Educational Unit Operations Pilot Plant
- Pressure Swing Adsorption Educational Unit Operations Pilot Plant
- Bench Scale Dual Column Gas Separation and Capture Educational Pilot Plant
- Multimodal Absorption and Desorption Pilot Plant for Unit Operations Training
People Also Ask
- How Do Flow Regimes Transition in Packed Bed Pilot Plants? Key Scale-up Insights
- How does reactant concentration determine absorption column control? Gas-film vs. dual-film.
- How is the packing height of an absorption column calculated? Master HTU & NTU Concepts
- How does static vs. operating holdup affect pilot plant calibration? Avoid Critical Scale-Up Errors
- Why is counter-current flow selected for gas absorption? Maximize Pilot Plant Efficiency