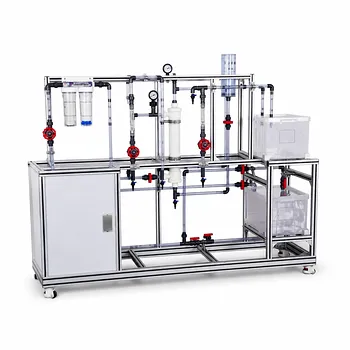
The most important lesson from a membrane pilot plant isn’t just reading pore sizes off a datasheet—it’s watching how separation reality transforms as you move from visible particles to invisible ions. When you operate Microfiltration (MF), Ultrafiltration (UF), and Reverse Osmosis (RO) units side by side, the fundamental differences to observe start with pore dimensions and then cascade into completely different separation mechanisms. MF uses a physical sieve with micron‑scale pores (0.1–10 µm) to trap suspended solids under very low pressure. UF employs nanometer‑scale pores (1–100 nm) that exclude macromolecules based on size, operating at moderate pressures. RO relies on a dense, non‑porous film with effective pore sizes below 1 nm, forcing separation to occur via solution‑diffusion at high pressures that overcome osmotic pressure.
The three processes form a gradient of increasingly selective barriers. As pore size shrinks from microns to sub‑nanometer, the separation mechanism shifts from straightforward sieving to solution‑diffusion, and the pilot plant’s driving force must rise dramatically—from a fraction of a bar to tens of bars—because you are no longer just filtering particles; you are reversing the natural flow of water across a semi‑permeable membrane.
The Three Fundamental Separation Regimes
Microfiltration: The Sieve You Can Almost See
Microfiltration membranes have the largest pores, typically 0.1–10 µm.
They operate under very low transmembrane pressure (commonly <2 bar).
The mechanism is purely physical sieving: particles larger than the pore are retained while everything smaller passes through.
In a pilot unit, you will see rapid flux and a visually dramatic reduction in turbidity.
Typical retentates include bacteria, yeast cells, suspended solids, and pollen.
The process creates little osmotic resistance because retained particles are large and do not dissolve to create osmotic pressure.
Ultrafiltration: The Molecular Gatekeeper
Ultrafiltration membranes have pores in the 1–100 nm range, often characterized by a molecular weight cut‑off.
Separation still relies primarily on size exclusion, but it now targets dissolved macromolecules such as proteins, enzymes, and starch.
Because these solutes are macromolecular, their contribution to osmotic pressure is negligible, so the pilot plant operates at moderate pressures (1–10 bar).
Students can observe that salts, sugars, and small peptides slip into the permeate while proteins and colloids are concentrated in the retentate.
The permeate is clear, but unlike RO, it will still conduct electricity—a quick test that confirms dissolved ions pass through unimpeded.
Flux decline in UF is dominated by concentration polarization and fouling, not by osmotic back‑pressure.
Reverse Osmosis: The Barrier That Defies Osmosis
Reverse Osmosis employs a dense, non‑porous active layer with an effective pore size below 1 nm.
The separation mechanism is solution‑diffusion: water molecules dissolve into the membrane and diffuse through under the influence of an enormous pressure gradient.
This is not sieving—the membrane rejects even monovalent salts like sodium chloride because the hydrated ions cannot enter the dense polymer matrix.
Operating an RO pilot unit forces you to confront osmotic pressure.
For seawater (~35 g L⁻¹), the osmotic pressure is about 2.5 MPa (25 bar); your pump must exceed this before any permeate appears.
Students will notice pressure gauges showing 10–80 bar, orders of magnitude higher than MF or UF, and the permeate will have near‑zero conductivity.
What the Pilot Plant Reveals That a Textbook Cannot
Pressure Gauges Tell a Dramatic Story
Watching the pressure transducer is an immediate, visceral lesson.
MF runs at barely a whisper—0.1–0.5 MPa—while RO demands a loud, high‑pressure pump to overcome the osmotic barrier.
The jump in pressure as you switch from UF to RO is not subtle; it’s a clear indicator that the driving force must overcome the solution’s innate desire to hold onto its water.
Flux vs. Selectivity Trade‑off
In pilot tests with interchangeable modules, you can feed the same mixture (e.g., a salt solution) through each membrane.
MF shows high flux but no separation of dissolved species; UF rejects proteins but passes salts; RO passes only water.
This trade‑off—the tighter the barrier, the lower the intrinsic permeance—is a practical truth you can quantify by measuring permeate flow rate against rejection.
Real‑Time Visual Feedback
MF units let you see a turbid feed become sparkling clear because suspended particles are enormous compared to UV‑visible wavelengths.
UF permeate is also clear, but the feed may still appear dark if coloured macromolecules are present; you can detect their concentration by absorbance.
RO permeate is ultrapure, making it an ideal spot check for ion‑selective electrodes or conductivity meters—students can confirm that even a trace of salt is absent.
The Hidden Dependence on Osmotic Pressure
MF and UF are immune to osmotic pressure because the solutes they retain (cells, proteins, colloids) have a negligible number of dissolved species per unit volume.
In RO, every mole of dissolved salt creates a counter‑force proportional to its concentration; the osmotic pressure of a typical NaCl solution can be calculated and directly compared to the pump pressure reading.
This is a crucial lesson for students: if you try to desalinate a solution with a UF membrane, your pump pressure will be low, but the permeate will still taste salty—because UF cannot reject ions.
Navigating the Trade‑offs and Pitfalls
Fouling Knows No Boundaries
Even though mechanisms differ, fouling affects all three processes.
MF suffers from cake layer formation on the surface, often reversible. UF must contend with protein adsorption and gel polarization, which can be partially reversed by cleaning. RO faces scaling and biofouling; the high pressure makes irreversible compaction a real risk if pretreatment is poor.
Energy Consumption Balloons with Selectivity
The pilot plant’s energy meter will tell the story: MF and UF are relatively low‑energy processes, while RO is power‑intensive.
This is not just a design choice—it’s a physical necessity.
Overcoming osmotic pressure and maintaining flux through a dense membrane demands an order of magnitude more energy than sieving a micron‑sized particle.
No Single Membrane Does Everything
A common student mistake is to assume a “finer” membrane is always better.
Using RO to clarify a fermentation broth would be disastrous—the dense membrane would foul instantly and require outrageous pressure.
The pilot plant teaches that membrane selection must match the size of the target solute: MF for clarification, UF for concentration of biologics, RO for desalination.
How to Design Your Observation Experiments
The pilot plant is your laboratory for building an intuitive grasp of pressure‑driven separation. Use these goal‑driven experiments to get the most out of the experience.
- If your primary focus is comparing separation mechanisms: Feed a mixed solution containing a visible suspension, a coloured protein, and a salt. Measure the permeate turbidity (MF removes particles), colour or UV absorbance (UF retains protein), and conductivity (RO rejects salt). This one experiment maps each mechanism onto a measurable property.
- If your primary focus is understanding the role of osmotic pressure: Run the RO unit with pure water, then with a saline solution of known concentration. Record the minimum pressure needed to produce permeate. Plot osmotic pressure versus concentration and observe the linear relationship. Repeat with the UF module—the same salt solution will show flux at low pressure, proving osmotic pressure is irrelevant.
- If your primary focus is evaluating industrial applicability: Simulate a real process stream. For biotech, use a yeast suspension through MF to mimic clarification. For dairy, run a protein solution through UF to model whey concentration. For water treatment, use a brackish feed through RO to predict desalination plant performance. Monitor flux decline, rejection, and cleaning cycles to learn about system sizing.
The pilot plant transforms abstract membrane specs into a tangible lesson: smaller pores demand higher stakes—a truth you’ll see in every rising pressure gauge and every drop of purified water.
Summary Table:
| Membrane Type | Pore Size | Separation Mechanism | Operating Pressure | Typical Retentates |
|---|---|---|---|---|
| Microfiltration (MF) | 0.1–10 µm | Physical Sieving | Very Low (<2 bar) | Suspended solids, bacteria, yeast |
| Ultrafiltration (UF) | 1–100 nm | Size Exclusion | Moderate (1–10 bar) | Macromolecules, proteins, colloids |
| Reverse Osmosis (RO) | <1 nm | Solution-Diffusion | High (10–80 bar) | Dissolved salts, monovalent ions |
Bring Hands-On Membrane Technology to Your Lab
Looking to enhance your curriculum or research? LABPARK provides high-quality Educational and Vocational Unit Operations Pilot Plants in chemical engineering, bioprocess & biotech, and environmental & water treatment. Designed specifically for universities, research institutes, and enterprises, our pilot units help students and researchers transition seamlessly from theoretical concepts to practical, real-world system operations.
Contact LABPARK today to find the perfect pilot plant solution for your institution!
Related Products
- Multifunctional Membrane Separation Educational Pilot Plant with Ultrafiltration, Nanofiltration, Reverse Osmosis
- Multi-Functional Membrane Separation Educational Pilot Plant for Unit Operations Lab
- Ultrafiltration Membrane Separation Educational Pilot Plant
- Hollow Fiber Ultrafiltration Membrane Separation Educational Pilot Plant
- Photocatalytic Membrane Separation and Degradation Unit Operations Pilot Plant
People Also Ask
- Pervaporation vs. Vapor Permeation: Handling Suspended Solids in Membrane Pilot Plants
- How do PEI, PVDF, and PSU membranes compare in pilot plants? Find the best fit.
- What are the trade-offs of polymer vs inorganic membranes in teaching pilot plants? Key laboratory comparison.
- What are the key flow configuration loops in membrane pilot plants? Optimize Performance
- What are the advantages of membrane separation in pilot plants? Efficient Organic Vapor Recovery