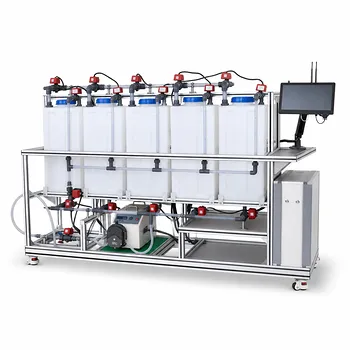
A strong electrolyte—like a bolt of lightning through a copper wire—shatters into ions completely, while a weak one holds back, establishing a chemical truce. In an educational chemical engineering pilot plant, students can harness inline conductivity probes and pH transmitters to directly observe this profound difference. By flowing equimolar solutions of a strong acid (e.g., hydrochloric acid) and a weak acid (e.g., acetic acid) through identical process vessels, they’ll instantly see the strong electrolyte’s far higher conductivity and lower pH, and then use that real-time data to compute the weak acid’s ionization constant ((K_a))—transforming an abstract equilibrium concept into a tangible, industrial-scale measurement.
While strong electrolytes dissociate completely and generate maximum conductivity per mole of solute, weak electrolytes maintain a dynamic equilibrium between intact molecules and free ions. Pilot-plant instrumentation lets students quantify that equilibrium, revealing not just a number but how dissociation inefficiency ripples through mass balances, reaction rates, and downstream processing.
The Foundational Chemistry: Ionization and Conductivity
To read the signals from a pilot plant, students must first decode the language of ions in water.
The Tale of Two Acids: Full Charge vs. Partial Release
Strong electrolytes like HCl donate every possible proton to solution. A 0.1 M HCl solution is, for practical purposes, a 0.1 M (H^+) solution, pushing conductivity to the top of the scale. Acetic acid, however, follows a reversible path: (CH_3COOH \rightleftharpoons H^+ + CH_3COO^-). Even at the same molar concentration, a weak electrolyte behaves like a chemical traffic jam—most molecules stay undissociated, releasing only a fraction of the ions a strong counterpart would.
Conductivity: The Direct Readout of Ionic Freedom
Conductivity sensors measure how easily electricity flows through a liquid, and that current is carried almost exclusively by ions. The more ions, the higher the conductivity. Because a strong electrolyte releases every ion it possibly can, its conductivity per mole is immense. A weak electrolyte’s partial ionization yields a much lower reading, and that gap is the student’s first clue about the hidden equilibrium.
pH: The Proton’s Fingerprint
pH probes add a second, chemically specific lens. The pH is a direct function of free (H^+) concentration. A strong acid’s pH drops sharply with concentration, while a weak acid’s pH stays comparatively higher—even at identical molarity—because it simply refuses to release all its protons. Pairing pH with conductivity creates a redundant check that reinforces the equilibrium concept and guards against sensor drift.
Translating Theory to the Pilot Plant: Live Measurements That Tell a Story
Pilot-plant hardware transforms these principles from textbook graphs into living, breathing process data.
The Experimental Setup: Fair Comparisons
Students prepare two batches: one strong electrolyte, one weak, both at precisely the same molar concentration. They then run each solution through the plant’s reactor or mixing tank equipped with inline conductivity and pH transmitters. Keeping concentration, temperature, and flow rate identical ensures that any difference in the readings is due solely to ionization behavior. A simple side-by-side trend on the control interface screams the contrast.
From Raw Data to the Ionization Constant ((K_a))
With a pH value for the weak acid, students know ([H^+] = 10^{-pH}). For acetic acid at concentration (C_0), the equilibrium table yields (K_a = \frac{[H^+]^2}{C_0 – [H^+]}). The pilot plant turns a calculation that often feels like an algebra puzzle into a mission: you measured the pH, now unlock the acid’s personality. The same data can be used to back-calculate the degree of ionization, (\alpha = [H^+]/C_0), and suddenly the word “partial” gets a number—often below 5% for common weak electrolytes.
Visualizing Process Consequences
Why does this matter in chemical engineering? Because a weak electrolyte’s incomplete dissociation means mass balances written on the “as-added” concentration are wrong for reactive species. Students can compare expected reactor yields using the nominal concentration versus the actual free-ion concentration. The difference is a powerful lesson: what you put into a pipe is not necessarily what reacts in the vessel.
Beyond the Basics: Using the Common Ion Effect as an Advanced Exploration
Once students grasp the fundamental dissociation contrast, the pilot plant can unveil how equilibrium bends under external pressure.
Shifting the Balance with a Shared Ion
Adding a strong electrolyte that shares an ion with the weak electrolyte (e.g., sodium acetate to acetic acid) boosts the concentration of the product side of the equilibrium. Le Châtelier’s principle manifests as a measurable drop in pH and conductivity of the weak electrolyte, because the equilibrium shifts left, suppressing further dissociation. Students witness ionization being physically “turned down” by a process adjustment, a direct analog to buffer design and controlled crystallizations.
Industrial Relevance in a Teaching Loop
This isn’t a parlor trick. In crystallization, a common ion can force a product to precipitate by suppressing its solubility. In absorption, manipulating ionization equilibria alters gas-liquid transfer. By monitoring the pilot plant’s pH and conductivity in real time as sodium acetate flows into the acetic acid stream, students connect a simple sensor trend to decisions that shape yield and selectivity in full-scale plants. They learn that an instrument isn’t just a number; it’s a window into the molecule-level forces that govern process economics.
Understanding the Trade-offs and Limitations of Conductivity–pH Analysis
Even the most elegant inline sensors have boundaries. Teaching students to recognize those boundaries builds the analytical skepticism that distinguishes an operator from an engineer.
Concentration Isn’t the Whole Story—Temperature and Ionic Strength Interfere
Conductivity is a fickle friend. It drifts upward with temperature and flattens in high-ionic-strength solutions because ions crowd each other. If a pilot plant’s solutions heat up during a run, students must apply temperature compensation—or see conductivity rise even when ionization hasn’t changed. Recognizing this prevents the classic mistake of attributing a thermal drift to a chemical shift.
Sensor Calibration: The Invisible Foundation
A pH probe that hasn’t been calibrated to known buffers will spit out numbers that lie. Students must develop the discipline of calibrating before every critical experiment. A two-point buffer calibration is non-negotiable; skipping it turns a precision teaching tool into a random-number generator. Similarly, conductivity cells need regular checks against standard solutions. Without this fidelity, the entire (K_a) calculation collapses.
The Strong-Electrolyte Assumption Has Its Own Cracks
At very high concentrations, even a strong electrolyte like HCl doesn’t quite dissociate 100% perfectly due to ion pairing. The strong electrolyte then becomes a slightly-less-than-strong one. In pilot-plant teaching, this is a nuance, but pointing it out prevents the dangerous belief that any industrial measurement is an absolute truth. It plants the seed for activity coefficients, which govern real thermodynamics.
Making the Right Choice for Your Teaching Objective
The beauty of a pilot plant is that the same hardware can serve different pedagogical goals. Here’s how to align the experiment with what you want students to learn.
- If your primary focus is visualizing equilibrium concepts: Keep the experiment simple and stark. Compare a strong acid and a weak acid at the same concentration, measure pH and conductivity, and immediately let students calculate (K_a). The immediate “aha” is seeing the abstract equilibrium table materialize as a lower conductivity reading.
- If your primary focus is connecting chemistry to industrial process behavior: Add a common-ion injection step. Show how adding sodium acetate suppresses ionization and how that shift would alter a downstream crystallization yield. Have students sketch a basic mass balance to quantify the impact on available reactant.
- If your primary focus is teaching sensor and data literacy: Intentionally vary temperature or allow a probe to drift, then challenge students to spot the artifact. This turns the pilot plant into a detective game where the chemical truth is only accessible after compensating for instrument reality.
- If your primary focus is bridging thermodynamics and kinetics: Use the calculated free-ion concentration to explain why weak-electrolyte reactions often proceed slower. Compare a simulated reaction rate using nominal concentration versus the real ion population and discuss why engineers cannot assume full dissociation.
Gaining the ability to “see” ionization in real time through conductivity and pH transforms an abstract equilibrium into a controllable, measurable, and deeply instructive process event—exactly the lesson a pilot plant was meant to deliver.
Summary Table:
| Parameter | Strong Electrolyte (e.g., HCl) | Weak Electrolyte (e.g., Acetic Acid) |
|---|---|---|
| Dissociation | Complete (~100% ionization) | Partial (Dynamic equilibrium, typically <5%) |
| Conductivity | Extremely High (maximum free ions) | Low to Moderate (limited free ions) |
| pH Level | Very Low (high free $H^+$ concentration) | Moderately Acidic (lower free $H^+$ concentration) |
| Key Calculation | Direct concentration conversion | Ionization constant ($K_a$) & degree of ionization ($\alpha$) |
Elevate Process Education with LABPARK Pilot Plants
Bridge the gap between abstract chemical theory and hands-on industrial practice. LABPARK designs and delivers high-performance Educational and Vocational Unit Operations Pilot Plants in:
- Chemical Engineering (featuring advanced inline pH and conductivity measurement loops)
- Bioprocess & Biotech
- Environmental & Water Treatment
We empower universities, research institutes, and enterprises to provide students and trainees with industry-grade, hands-on experience in thermodynamics, sensor calibration, and process control.
Ready to enhance your department's training capabilities? Contact LABPARK today to customize your pilot plant setup!
Related Products
- Water Electrolysis Hydrogen Production and Storage Educational Pilot Plant
- Liquid-Liquid Mass Transfer Coefficient Determination Educational Pilot Plant
- Centrifugal Pump Performance and Orifice Flowmeter Calibration Educational Pilot Plant
- Two Phase Flow Pattern Velocity Resistance Measurement Educational Pilot Plant
- Ternary Liquid-Liquid Equilibrium Educational Pilot Plant
People Also Ask
- How do chemical engineering pilot plants demonstrate electrolysis? Bridge Theory & Industrial Scale
- In educational chemical engineering pilot plants, why use absorption and adsorption before reforming?
- How do chemical engineering unit operations pilot plants demonstrate catalytic high-purity hydrogen production from methane?
- SMR, POX, or ATR? Trade-offs in Hydrogen Production Educational Pilot Plants
- Gap-Electrode vs. Zero-Gap Membrane: Key Design Choices for Water Electrolysis Pilot Plants