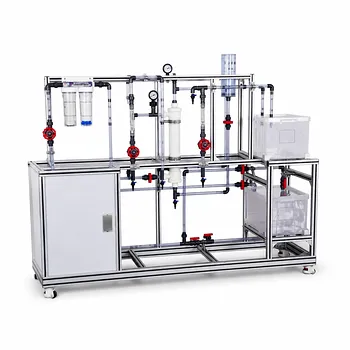
At higher pressures in an OSN pilot plant, concentration polarization becomes dangerously severe—it can force the solute concentration at the membrane surface to more than double the bulk value, pushing it dangerously close to the solubility limit. This creates a high risk of sudden gel‑layer formation, which chokes mass transfer, collapses permeate flux, and may degrade selectivity. Lab engineers must treat the boundary‑layer mass‑transfer coefficient and cross‑flow velocity as primary control knobs to avoid catastrophic fouling, and they must continuously monitor the polarization factor ($c_m/c_b$) to prevent the local concentration from entering the gelation zone.
Concentration polarization at high pressure is not a slow, linear nuisance—it’s a nonlinear threat. Once the surface concentration nears the solute’s solubility limit, a gel layer can form almost instantly, blocking flux and turning a high‑pressure advantage into an operational crisis. The answer is not to abandon high pressure, but to pair it with deliberate hydrodynamic control and real‑time boundary‑layer monitoring.
Understanding the Mechanism: Why High Pressure Intensifies Polarization
Concentration polarization is the accumulation of retained solute molecules in the boundary layer right against the membrane. Under normal conditions it reduces flux and can slightly worsen rejection. Under high pressure, however, the convective drag of solvent toward the membrane skyrockets, and the back‑diffusion of solute into the bulk stream cannot keep up.
The Local Concentration Runaway
At 40 bar, for example, a typical OSN system may see the membrane‑surface concentration climb to 0.72 M when the bulk concentration is only 0.3 M and the solubility limit sits at 0.76 M. This drastic buildup raises the local osmotic pressure and, crucially, increases the local viscosity right where permeation happens. The thicker, more concentrated layer then resists further solvent transport, creating a vicious cycle.
From Polarization to Gel‑Layer Formation
Once the surface concentration brushes the solubility limit, solute molecules can precipitate or form an immobile gel network on the membrane. This gel layer becomes a secondary filtration barrier with its own hydraulic resistance, often far larger than the membrane itself. The result is a sudden, sometimes irreversible, drop in permeate flux that cannot be fixed by simply turning down the pressure later.
The Rejection Deception
A subtler effect is the decline in observed solute rejection. Because the true concentration at the membrane surface ($c_m$) is much higher than the bulk ($c_b$), more solute leaks through the membrane—even if the intrinsic membrane selectivity is unchanged. An engineer measuring only bulk samples might mistakenly think the membrane is “defective,” when in fact the problem is a runaway polarization layer.
Operational Risks That Lab Engineers Must Monitor
The consequences of unchecked concentration polarization at high pressure move from performance degradation to physical membrane damage. The following risks demand continuous attention.
Gel‑Layer Fouling and Irreversible Flux Collapse
A gel layer can form within minutes once the critical surface concentration is reached. It frequently leads to permanent membrane fouling because the gel becomes compacted under high pressure and resists normal cleaning. A sudden, sharp drop in permeate flow rate while feed pressure remains constant is the classic alarm signal.
Exceeding the Solubility Limit (Scaling Risk)
In organic solvent systems, the “solubility limit” can apply to dissolved polymers, catalysts, or other solutes. If the local concentration crosses that limit, precipitation occurs—not just on the surface, but possibly within the pore mouths. This scaling risk can lock up the membrane irreversibly and may require aggressive chemical cleaning that shortens membrane life.
Loss of Separation Efficiency at the Worst Time
Because $c_m$ drives solute passage, a pilot plant racing to demonstrate high yield may suddenly produce permeate of unacceptable purity even though the membrane specification suggests it should work. This leads to wasted product, misleading scale‑up data, and a false sense that higher pressure always hurts selectivity.
Masked by Membrane Compaction
At pressures above ~20 bar, many OSN membranes undergo compaction, which raises membrane resistance and lowers flux. While compaction can partially offset polarization by reducing convective drag, it does not eliminate the risk—the local concentration can still surge if permeability is not reduced enough. The engineer must disentangle these two effects to avoid the dangerous assumption that “lower flux means safer operation.”
Critical Parameters to Track and Control
Effective polarization management depends on monitoring a few key variables and treating them as real‑time safety indicators.
Boundary‑Layer Mass‑Transfer Coefficient (k)
The mass‑transfer coefficient $k$ quantifies how efficiently solute is swept back from the membrane into the bulk. A low $k$ (caused by low cross‑flow velocity or poor flow geometry) directly inflates the $c_m/c_b$ ratio. In a pilot plant, calculating $k$ from flux‑pressure data or using empirical correlations gives an early warning before gelation occurs.
Concentration Polarization Factor ($c_m/c_b$ )
Aim to keep this ratio safely below the threshold that would hit the solubility limit. For example, if the solubility is 0.76 M and bulk concentration is 0.50 M, the maximum allowable polarization factor is only 1.52. Any operating condition that pushes it higher demands an immediate increase in cross‑flow velocity or a reduction in transmembrane pressure.
Trans‑Membrane Pressure (TMP) and Flux Behavior
Plotting flux versus TMP is a classic diagnostic. A deviation from a linear trend—especially a plateau or drop despite rising pressure—indicates that polarization resistance is dominating the system. This plateau is often the precursor to gel‑layer formation.
Feed Flow Rate and Cross‑Flow Velocity
These are the most direct levers. Higher velocity thins the boundary layer and raises $k$. In a pilot plant, the control system should be able to log cross‑flow velocity continuously and trigger an alert when it falls below a critical set point determined for the specific solvent‑solute system.
Practical Mitigation Strategies
Even at high pressure, concentration polarization can be contained if the hydrodynamic environment is engineered properly. These strategies build on the fundamental film theory.
Optimize Cross‑Flow Hydrodynamics
The simplest, most effective action is raising the feed flow rate. Turbulence promoters (mesh spacers) in spiral‑wound or plate‑and‑frame modules can also generate secondary flows that disrupt the stagnant boundary layer, dramatically increasing $k$ without requiring excessively high linear velocities.
Temperature Tuning for Solvent Systems
In organic solvents, a modest increase in feed temperature can lower viscosity and boost the solute diffusion coefficient. This speeds back‑diffusion and reduces the polarization factor. However, temperature must stay within membrane and solvent stability limits, and engineers must verify that solubility does not change unfavorably.
Multi‑Stage and Recirculation Designs
Rather than forcing extremely high single‑pass recovery, a pilot plant can use recirculation loops or split the process into stages. This keeps the bulk concentration in each stage lower, giving the boundary layer more headroom before hitting the solubility limit.
Routine High‑Flow Cleaning Pulses
Even with good control, a gel layer can begin to form. Short, periodic pulses at low pressure but maximum cross‑flow can sweep away thin gel films before they compact. Chemical cleaning should be reserved for true fouling events, as organic solvents may alter membrane chemistry.
Understanding the Trade‑offs
Managing concentration polarization is not a free exercise—it forces the engineer to balance competing objectives.
- Pressure vs. Flux Gain: Higher pressure increases the driving force, but the resulting polarization can negate the gain by adding massive boundary‑layer resistance. At some point, raising pressure actually delivers almost no additional permeate flow, only a larger $c_m$ and higher risk of gelation.
- Cross‑Flow Velocity vs. Energy Cost: Higher cross‑flow consumes pumping energy and may shear sensitive solutes. The optimal velocity is the lowest value that keeps $c_m$ safely below the solubility limit.
- Rejection Purity vs. Recovery Rate: Higher recovery concentrates the bulk, making polarization worse. A pilot plant aiming for maximum recovery may have to accept a penalty in permeate quality unless the number of stages or recirculation loops is increased.
- Membrane Life vs. Production Rate: Operating near the polarization limit may temporarily boost output, but frequent gel events and cleaning cycles shorten membrane lifespan. Conservative operation often yields better long‑term economics.
Making the Right Choice for Your Pilot Plant Goals
Your control strategy should match what you’re trying to prove or optimize in the pilot run.
- If your primary focus is demonstrating maximum flux potential: Operate at the highest cross‑flow velocity your pump and module can sustain, and systematically map pressure‑flux curves to identify the polarization plateau. Use that data to set the safe upper pressure limit.
- If your primary focus is predicting steady‑state rejection for scale‑up: Run at a conservative polarization factor (e.g., $c_m/c_b$ < 1.3) so that observed rejections reflect true membrane separation rather than boundary‑layer artifacts. Couple your data with film‑theory calculations to correct for any residual polarization.
- If your primary focus is evaluating long‑term membrane resilience: Cycle the pressure up and down while monitoring flux stability and $c_m/c_b$. Note the pressure at which irreversible flux decline appears—that is your real‑world operating ceiling, regardless of the membrane’s datasheet rating.
By treating the boundary‑layer mass‑transfer coefficient as a critical pilot‑plant instrument rather than a theoretical footnote, you turn concentration polarization from a silent process‑killer into a manageable variable that unlocks the true value of high‑pressure OSN.
Summary Table:
| Key Parameter/Risk | Operational Impact | Practical Mitigation Strategy |
|---|---|---|
| Polarization Factor ($c_m/c_b$) | Drives gel-layer formation and scaling | Increase cross-flow velocity; decrease TMP |
| Mass-Transfer Coeff. ($k$) | Determines rate of back-diffusion | Optimize feed flow rate; use mesh spacers |
| Flux Collapse & Fouling | Causes permanent membrane compaction | Implement routine low-pressure cleaning pulses |
| Rejection Decline | Lowers observed permeate purity | Adjust temperature; utilize multi-stage designs |
Optimize Your Membrane Filtration Research with LABPARK
Managing boundary-layer dynamics is critical to preventing irreversible membrane fouling. LABPARK provides state-of-the-art Educational and Vocational Unit Operations Pilot Plants in chemical engineering, bioprocess & biotech, and environmental & water treatment. Specifically designed for universities, research institutes, and enterprises, our pilot systems offer the precise hydrodynamic controls needed to mitigate polarization risks.
Ready to elevate your lab's separation efficiency? Contact us today to discuss your custom pilot plant requirements!
Related Products
- Multifunctional Membrane Separation Educational Pilot Plant with Ultrafiltration, Nanofiltration, Reverse Osmosis
- Multi-Functional Membrane Separation Educational Pilot Plant for Unit Operations Lab
- Ultrafiltration Membrane Separation Educational Pilot Plant
- Photocatalytic Membrane Separation and Degradation Unit Operations Pilot Plant
- Multi Functional Membrane Crystallization Educational Unit Operations Pilot Plant
People Also Ask
- Pervaporation vs. Vapor Permeation: Handling Suspended Solids in Membrane Pilot Plants
- How do PEI, PVDF, and PSU membranes compare in pilot plants? Find the best fit.
- What are the trade-offs of polymer vs inorganic membranes in teaching pilot plants? Key laboratory comparison.
- What are the key flow configuration loops in membrane pilot plants? Optimize Performance
- What are the advantages of membrane separation in pilot plants? Efficient Organic Vapor Recovery