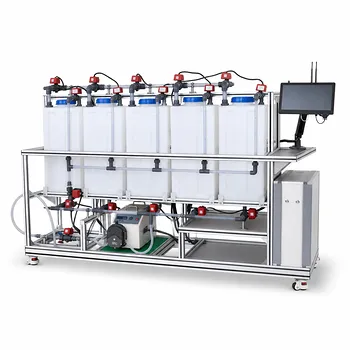
Demonstrating the full operational cycle—both exhaustion and regeneration—is exactly how an ion exchange pilot plant bridges the gap between textbook theory and industrial reality. It allows you to observe the continuous service cycle where hardness ions are removed, and then execute the controlled chemical restoration where the resin's capacity is recovered, providing a closed-loop view of the entire process.
The true value of an ion exchange pilot plant is not just in softening water, but in revealing the fundamental engineering trade-off between maximizing resin capacity and minimizing the cost of chemical regenerants. It transforms the abstract concept of stoichiometry into a tangible lesson in process economics and environmental waste management.
Understanding the Exhaustion Phase: The Service Cycle in Action
The demonstration of the operational cycle begins with the exhaustion phase, also known as the service run. This is where the pilot plant showcases the resin's primary function of removing target ions from a feed solution.
Monitoring the Breakthrough Curve
During operation, the pilot plant feeds a solution containing hardness ions (like calcium) or other contaminants at a controlled flow rate. Users learn to collect samples from the column effluent at regular intervals. By measuring the hardness concentration over time, you plot a breakthrough curve.
This curve shows the point where the resin can no longer keep up. Initially, the effluent will be completely soft, but eventually, ions begin to "break through" into the treated water. This demonstrates the concept of a mass transfer zone (MTZ) moving through the bed, translating a theoretical principle into a visual, data-driven graph.
Validating Resin Capacity
The primary reference's concept of calculating resin capacity is physically demonstrated here. The pilot plant provides the data to calculate the total exchange capacity using the actual water volume treated before breakthrough and the feed concentration.
As one reference points out, the core formula is: (Liters of water consumed * Water hardness in ppm CaCO3 * 437) / (mL of resin in the column). This live calculation proves the theoretical capacity of the specific media, whether it's a high-capacity synthetic polystyrene resin or a standard cation resin, and directly informs the design parameter of required resin bed volume for a given job.
Demonstrating the Regeneration Cycle: A Four-Stage Restoration
Once a target breakthrough—like an 80% bed load—is reached, the pilot plant switches to regeneration mode, which is the most critical demonstration. You witness how chemical energy, not just physical filtration, restores the resin by executing a precise multi-stage sequence.
Stage 1: Backwash and Bed Classification
The cycle begins with a backwash, demonstrating a purely physical yet vital step. Water is pumped upward through the column to fluidize and reclassify the bed. This visually shows how fines, debris, and any accumulated suspended solids are flushed out.
This step is critical to learning because it prevents the channeling that would otherwise cause uneven flow and ineffective softening. The pilot plant scale allows for a clear view of bed expansion and the removal of physical foulants.
Stage 2 & 3: Brining and the Slow Rinse
The chemical heart of regeneration is the introduction of a concentrated regenerant, such as a 10% NaCl brine for a softening resin. This demonstrates the principle of mass action: using a large excess of sodium ions to force the captured calcium ions off the resin's functional groups.
The pilot plant's metering pumps allow for a controlled brine draw at a slow rate. Users can then observe the subsequent slow rinse, which displaces the brine through the resin bed's void spaces. This directly teaches a key design parameter—the void volume of the bed is typically 45-50% of its total volume—and shows why a slow flow is necessary for efficient chemical contact.
Stage 4: Fast Rinse and Quality Verification
The final stage is the fast rinse, flushing residual brine and displaced hardness ions from the bed. In a pilot plant setting, this ends with quality control, as you monitor the effluent until its hardness drops below a set limit, like 1 ppm CaCO3. This step teaches practical operation, verifying that the resin is truly back in service mode and not sending regenerant chemicals out during the next plant product water run.
Optimizing the Trade-off Between Cost and Efficiency
Perhaps the most profound lesson a pilot plant provides is not just that regeneration works, but how efficiently it works. This addresses the engineering deep need of process optimization.
Plotting the Salt Efficiency Curve
The supplementary references highlight the ability to plot a salt efficiency curve. By running multiple exhaustion-regeneration cycles with different brine dosages (e.g., varying from 2 to 15 lbs of NaCl per cubic foot), you can experimentally determine that the relationship is not linear. There is an optimum point, around 0.5 lb NaCl per kilograin of CaCO3 removed, beyond which adding more salt yields only marginal improvements in capacity and becomes uneconomical—a fact that can only be fully appreciated through hands-on manipulation of these variables.
Addressing Industrial Troubles like Iron Fouling
The pilot plant is an invaluable tool for demonstrating complex failure modes like iron fouling. A standard brine regeneration is shown to have little effect on removing high-valence ferric ions (Fe3+) that accumulate and cause bed pressure drop and channeling. This sets up a powerful demonstration of a corrective cleaning procedure: switching the regenerant to a 10% hydrochloric acid (HCl) solution.
Users can observe how the hydrogen ions displace the ferric ions, and the chloride ions form a stable, non-readsorbing anionic complex. This single experiment links chemistry fundamentals to a common, costly industrial maintenance problem and its solution.
Common Pitfalls to Avoid
Pilot plant work is meant to teach you how to prevent real-world failures. Ignoring these lessons leads directly to poor performance.
- Operating Beyond 80% Load: Designing a system to use 100% of the resin's total capacity before regeneration inevitably leads to hard water breakthrough during the service run. Pilot plants teach the necessity of an operational safety margin.
- Neglecting Wastewater Management: The regeneration process produces a high-salinity, concentrated waste stream. Students often overlook this, but a pilot plant quantifies it, driving home the challenge of wastewater management and disposal costs for a full-scale system.
- Incorrect Brine Concentration: Using a brine that is too dilute will not provide the necessary chemical driving force for efficient regeneration, wasting salt and time. The 10% NaCl standard is a proven balance for mass transfer efficiency.
How to Apply This to Your Project
A pilot plant is a scale-up tool. The data you generate in a lab directly translates to the design and operation of full-scale systems.
- If your primary focus is designing a new treatment system: Calculate the specific resin capacity (mmol/mL) from your pilot runs and determine the exact bed volume needed to treat your daily flow, directly translating lab data to process specification.
- If your primary focus is minimizing operational costs: Run multiple regeneration cycles to plot your own salt efficiency curve, and identify the exact salt dosage that gives you the lowest operating cost per gallon of water treated.
- If your primary focus is troubleshooting a fouling issue: Use the pilot plant to simulate the fouling condition and test different cleaning procedures, like an HCl wash for iron, to validate a restoration protocol before applying it to an expensive industrial column.
By mastering the operational cycle on a pilot scale, you gain an intuitive, data-backed understanding of ion exchange that transforms you from a theoretical designer into a capable process troubleshooter.
Summary Table:
| Stage | Key Action | Process & Learning Objective |
|---|---|---|
| 1. Exhaustion (Service) | Monitor effluent hardness & plot breakthrough curve | Understand Mass Transfer Zone (MTZ) and calculate resin capacity |
| 2. Backwash | Pump water upward to fluidize and reclassify the bed | Remove physical foulants and prevent channeling |
| 3. Brining & Slow Rinse | Introduce 10% NaCl brine to displace hardness ions | Execute chemical regeneration and utilize bed void volume |
| 4. Fast Rinse | Flush residual brine and verify effluent quality (<1 ppm) | Return the resin bed to service mode safely |
| 5. Optimization | Vary chemical dosages to plot salt efficiency curves | Balance chemical cost against capacity recovery |
Bring Industrial Process Scaling to Your Lab
Ready to bridge the gap between textbook theory and practical water treatment? LABPARK provides high-quality Educational and Vocational Unit Operations Pilot Plants in chemical engineering, bioprocess & biotech, and environmental & water treatment for universities, research institutes, and enterprises.
Our pilot plants allow students and researchers to visualize complex chemical dynamics, analyze breakthrough curves, and optimize regeneration cycles with real-world accuracy.
Enhance your laboratory's training capabilities and research depth — contact us today to find the ideal pilot plant solution for your needs!
Related Products
- Electrochemical Water Treatment Educational Unit Operations Pilot Plant
- Ion Exchange Water Purification Educational Pilot Plant for Engineering Unit Operations
- Dual-Mode Rectification Pilot Plant for Practical Training Unit Operations
- Multi-Functional Membrane Separation Educational Pilot Plant for Unit Operations Lab
- Alkaline Membrane Water Electrolysis Educational Pilot Plant Unit Operations Training System
People Also Ask
- What design features do educational electrochemical pilot plants utilize to manage gas liberation and water loss?
- How can unit operations pilot plants show lead-acid concentration vs state of charge? Real-time monitoring guide.
- How do educational electrochemical pilot plants scale up electrolysis? Master industrial engineering.
- How to Estimate Sulfate in Water Treatment Pilot Plant Deposits: Gravimetric Guide
- How can foaming be managed during steam generation experiments in water treatment unit operations pilot plants? Tips