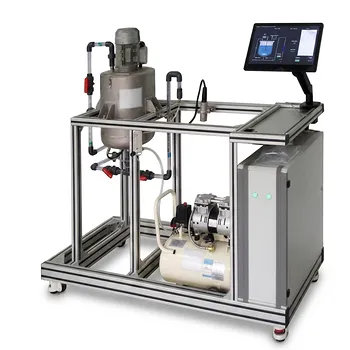
Educational unit operations pilot plants turn process analysis into an observable engineering activity. By operating equipment such as distillation columns, absorbers, heat exchangers, and reactors, students compare conservation-law models with measured behavior, develop empirical correlations from experimental data, and use dimensional analysis to organize transport phenomena. The result is a direct connection between chemical engineering theory, real process variables, and practical design decisions.
Pilot plants support process analysis by allowing students to move through the full cycle of modeling, measuring, correlating, and validating. They show where ideal equations work, where empirical corrections are necessary, and how scale and operating conditions affect process performance.
How Pilot Plants Connect Theory to Process Behavior
From equations to operating equipment
A pilot plant gives physical meaning to mathematical models based on mass, energy, and momentum conservation. Students can apply these equations to actual streams, temperatures, pressures, flow rates, compositions, and equipment dimensions.
For example, a heat exchanger can be analyzed through an energy balance, while a distillation or absorption column can be evaluated using material balances and phase-equilibrium relationships.
Making assumptions visible
Process calculations require assumptions such as steady state, negligible heat loss, ideal mixing, or constant physical properties. On real equipment, students can test whether these assumptions are reasonable rather than accepting them automatically.
Measured deviations help learners understand that a model is a simplified representation of a process—not a complete substitute for observation.
Comparing predictions with measurements
Students can calculate expected operating results and compare them with pilot-plant data. Differences may arise from heat losses, pressure drop, nonideal phase behavior, measurement uncertainty, or incomplete mixing.
This comparison develops an essential engineering habit: use experiments to evaluate models and use models to interpret experiments.
Developing Empirical Correlations from Data
Converting measurements into engineering relationships
Pilot plants generate the experimental data needed to formulate or evaluate empirical correlations. Students can relate measured variables such as flow rate, pressure drop, temperature difference, or concentration change to performance indicators.
Examples include determining friction factors in pipe flow or estimating heat-transfer coefficients in tubes.
Using graphical methods effectively
Graphing helps students identify trends that may not be obvious from tables of numbers. Standard plots can reveal direct relationships, while semilog and log-log plots can help identify exponential or power-law behavior.
A log-log plot, for instance, can help determine whether a measured quantity follows a relationship of the form (y = ax^b) by making the exponent visible as a slope.
Recognizing the limits of correlations
Empirical correlations are usually valid only within the range of conditions used to develop them. Pilot-plant experiments therefore teach students to report the relevant flow regime, geometry, fluid properties, temperature, pressure, and other boundaries.
This prevents a common error: applying a convenient correlation outside the conditions where it is reliable.
Applying Dimensional Analysis to Transport Phenomena
Reducing complex variable sets
Transport processes often depend on many dimensional variables. Dimensional analysis helps students combine them into dimensionless groups and reduce the complexity of experimental interpretation.
In equipment such as pipes, heat exchangers, absorbers, and reactors, this approach supports the analysis of relationships among flow, geometry, material properties, and transfer rates.
Linking pilot-scale behavior to general principles
Dimensionless analysis provides a framework for comparing different operating conditions and equipment sizes. Rather than treating every experiment as an isolated case, students can organize results according to dimensionless parameters and look for common behavior.
This is particularly valuable when discussing scale-up, because dimensional similarity helps indicate which physical effects may remain comparable between laboratory, pilot, and industrial systems.
Connecting theory and correlation
Dimensionless groups also connect fundamental laws with empirical correlations. A theoretical balance may establish the structure of a relationship, while experimental data determine coefficients or functional forms that account for real fluid flow, heat transfer, or mass transfer behavior.
Students therefore see that dimensional analysis is not separate from modeling or experimentation; it helps organize both.
Integrating the Three Analytical Methods
A complete experimental workflow
A well-designed pilot-plant exercise can combine all three paradigms:
- Develop a model from conservation laws.
- Identify the assumptions required by the model.
- Operate the unit and collect process data.
- Compare calculated and measured results.
- Plot the data to identify trends.
- Develop or assess an empirical correlation.
- Reorganize the results using dimensionless groups.
- Evaluate whether the conclusions apply beyond the tested conditions.
This workflow mirrors the way process engineers analyze real equipment.
Studying interacting unit operations
Modular pilot plants can also show how one unit operation affects another. Changes in reaction temperature, pressure, flow rate, or space velocity may influence downstream separation efficiency and final product purity.
That systems perspective is difficult to obtain from isolated textbook problems. It helps students understand that process variables are connected across the flowsheet.
Building practical engineering judgment
Operating physical equipment requires students to interpret imperfect data, recognize unstable conditions, and distinguish process effects from measurement errors. These experiences strengthen quantitative problem-solving while reinforcing process safety and operational discipline.
The goal is not merely to obtain a numerical answer. It is to decide whether the answer is physically credible and useful for design or control.
Understanding the Trade-offs
Pilot data are more realistic but less controlled
Real equipment exposes students to nonideal behavior, but it also introduces noise, heat loss, instrumentation limitations, and operating variability. Results may therefore be less clean than those from a carefully controlled bench experiment.
That limitation is educationally valuable, provided students account for uncertainty rather than treating every discrepancy as a theoretical failure.
Scale-up is not automatic
A pilot plant is closer to industrial operation than laboratory glassware, but it does not reproduce every industrial effect. Differences in geometry, residence time, mixing, heat removal, pressure, and fluid properties can alter performance.
Dimensional analysis and carefully bounded correlations can support scale-up, but they cannot eliminate the need for engineering judgment and validation.
Empirical fits can conceal physical causes
A correlation may reproduce measured data without explaining the underlying mechanism. Students should therefore use empirical relationships alongside physical models whenever possible.
A strong analysis asks both “What curve fits the data?” and “What process behavior explains the curve?”
More variables increase experimental complexity
Pilot plants allow manipulation of temperature, pressure, flow rate, agitation, composition, and other factors. However, changing too many variables at once can make cause and effect difficult to identify.
Structured experimentation, including clearly defined controllable, noise, and experimental variables, helps produce interpretable results.
How to Apply This to Your Laboratory Instruction
Pilot-plant instruction is most effective when each experiment deliberately connects measurements to a model, a correlation, and a dimensionless interpretation.
- If your primary focus is fundamental modeling: Begin with mass, energy, and momentum balances, state the assumptions explicitly, and compare predicted performance with measured pilot-plant results.
- If your primary focus is empirical correlation: Collect data over a defined operating range, use appropriate standard, semilog, or log-log plots, and state the limits of the resulting correlation.
- If your primary focus is dimensional analysis: Identify the governing variables, form relevant dimensionless groups, and use them to compare operating conditions or assess scale-up behavior.
- If your primary focus is process design and operation: Integrate several unit operations so students can observe how changes in one stage affect downstream performance, purity, energy use, and control.
- If your primary focus is experimental quality: Include uncertainty evaluation, equipment limitations, safety considerations, and structured variation of critical process parameters.
Educational pilot plants make process analysis tangible by showing students how physical laws, experimental correlations, and dimensional reasoning work together to explain and design real chemical processes.
Summary Table:
| Process analysis method | How pilot plants support learning | Typical applications |
|---|---|---|
| Fundamental physical laws | Students apply mass, energy, and momentum balances to measured process conditions and test model assumptions. | Heat exchangers, distillation columns, absorbers, reactors |
| Empirical correlations | Experimental data are graphed and analyzed to identify relationships and estimate performance parameters. | Friction factors, heat-transfer coefficients, pressure drop |
| Dimensional analysis | Dimensional variables are organized into dimensionless groups to compare operating conditions and assess scale-up. | Fluid flow, heat transfer, mass transfer, reactor performance |
| Model validation | Predicted results are compared with measurements to evaluate nonideal behavior, uncertainty, and equipment limitations. | Heat loss, pressure drop, mixing, phase behavior |
| Integrated process analysis | Multiple unit operations reveal how changes in one stage affect downstream performance and product quality. | Process design, control, energy use, and system operation |
Equip students and researchers with practical process analysis experience through LABPARK Educational and Vocational Unit Operations Pilot Plants. Our modular systems for chemical engineering, bioprocess and biotechnology, and environmental and water treatment help universities, research institutes, and enterprises connect theory with measurable process behavior. Students can investigate mass, energy, and momentum balances, develop empirical correlations, apply dimensional analysis, evaluate scale-up conditions, and build confidence operating real equipment. Contact LABPARK to discuss your teaching, research, or industrial training requirements and identify the right pilot-plant configuration for your laboratory.
Related Products
- Multi-Reactor Educational Pilot Plant for Reaction Engineering Unit Operations
- Multi-Functional Membrane Separation Educational Pilot Plant for Unit Operations Lab
- Electrolytic Hydrogen Production Educational Unit Operations Pilot Plant
- Comprehensive Fluid Mechanics Educational Unit Operations Pilot Plant
- Multi-Functional Drying Educational Unit Operations Pilot Plant
People Also Ask
- How do reactor pilot plants define QbD design space? Master chemical process scale-up.
- When configuring a reactor unit operations pilot plant for highly exothermic reactions, how to prevent thermal runaway?
- How do metal ion-catalyzed reaction mechanisms inform chemical engineering pilot plant design? From kinetics to scale-up
- What role do educational pilot plants play in scaling green chemistry? Bridging the Lab-to-Industry Gap
- What are the barriers to process intensification & how do pilot plants help?