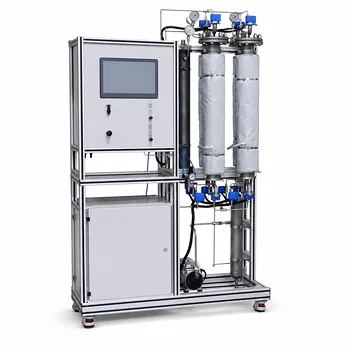
At its core, the answer lies in high-pressure, high-precision simulation.
Chemical engineering unit operations pilot plants equipped with high-pressure PVT (Pressure-Volume-Temperature) cells and viscometers enable you to replicate deep reservoir conditions—typically up to 120°F and 2,000 psia—and directly measure how dissolved CO₂ slashes crude oil viscosity. By precisely controlling saturation pressure, you generate a viscosity-pressure curve that reveals the dramatic drop in mixture flow resistance. This experimental data becomes the foundation for evaluating gas-injection enhanced oil recovery (EOR) strategies and training students on real-world multi-phase thermodynamics.
The true power of these pilot plants is not in measuring a single viscosity number, but in creating a controlled environment to map the entire viscosity-pressure relationship. This curve captures the interplay of CO₂ solubility, oil swelling, and flow behavior, showing how injection pressure directly translates to improved mobility and oil displacement efficiency under actual reservoir conditions.
How the Pilot Plant Configuration Unlocks Viscosity Data
The Core Hardware: High-Pressure PVT Cells and Viscometry
A pilot plant built for CO₂-crude oil studies essentially acts as a miniature, instrumented reservoir. The heart of the system is a high-pressure PVT cell where oil and CO₂ are mixed at controlled ratios. Integrated viscometers—often of the capillary or electromagnetic type—measure the mixture’s shear resistance directly at in-situ conditions, eliminating the need to flash samples to ambient pressure where dissolved gas would escape.
Precise Control of Temperature and Pressure
Reservoir temperature (e.g., 120°F) and pressure are held constant using electrical heating jackets and precision back-pressure regulators. The operator can then ramp up the CO₂ saturation pressure stepwise, allowing the mixture to reach equilibrium after each increment. This tight control makes it possible to isolate the effect of CO₂ concentration from thermal effects, producing clean, reproducible data.
Generating Viscosity-Pressure Curves
As CO₂ pressure increases, more gas dissolves. The pilot plant records the corresponding mixture viscosity at each pressure point, generating a viscosity ratio curve (mixture viscosity divided by original oil viscosity). These curves typically show an exponential-like decay, with the steepest reduction occurring just below the minimum miscibility pressure. The result is a quantitative map that engineers use to select optimal injection pressures for EOR projects.
Why Viscosity Reduction Matters: The Physics of Mobility
The CO₂ Dissolution Mechanism
Crude oil viscosity is dominated by internal friction between large hydrocarbon molecules. When CO₂ dissolves, it acts as a molecular lubricant, physically separating these long chains. The pilot plant demonstrates that higher saturation pressure forces more gas into solution—up to 65 mol percent CO₂ under typical reservoir conditions—leading to a proportional drop in the mixture’s internal resistance to flow.
The 100-Fold Drop and Improved Mobility Ratio
In many heavy oil systems, dissolved CO₂ can reduce viscosity by up to 100-fold. This dramatically improves the mobility ratio (the ability of the injected fluid to push oil versus bypass it) and prevents the gas from fingering through high-permeability streaks. Measuring this directly in a pilot plant gives reservoir engineers the confidence that CO₂ injection will sweep oil efficiently rather than channel through to production wells unused.
Flow Assurance and Pump Sizing Insights
The measured viscosity also feeds directly into unit operations calculations. Fluid viscosity determines the Reynolds number, flow regime, and frictional pressure drop. In the pilot plant, you can observe how a lowered viscosity reduces pumping requirements and line losses. This data is critical for sizing injection compressors and production pipelines, and for calibrating flowmeters that rely on accurate viscosity-compensated measurements.
Beyond Viscosity: A Multi-Mechanism View of CO₂ EOR
CO₂ Solubility and Density Matching
The same pilot plant setup measures how much CO₂ dissolves at a given pressure. At high concentrations, the density of the CO₂-oil mixture approaches that of the injected gas, minimizing gravity override—a common cause of poor vertical sweep efficiency. This solubility data, when combined with viscosity measurements, paints a complete picture of why CO₂ flooding works.
Oil Volumetric Swelling
Dissolved CO₂ not only thins the oil, it swells it. A 65 mol percent CO₂ mixture can increase the oil phase volume by up to 25 percent, physically pushing residual oil from dead-end pores toward production wells. The pilot plant’s PVT cell captures this swelling factor through direct visual or density measurement, adding another piece to the EOR evaluation puzzle.
Integrating Data for a Holistic EOR Assessment
By running the pilot plant at multiple pressure levels, you collect a suite of properties—viscosity, solubility, density, and swelling—from a single experimental campaign. This integrated dataset enables a robust analysis of displacement efficiency, showing that viscosity reduction works hand-in-hand with these other mechanisms to boost recovery by a significant margin.
Understanding the Trade-offs and Limitations
Dead Oil vs. Live Reservoir Fluids
Most pilot-scale studies must recombine dead crude oil with pure CO₂ or synthetic gas. This is a necessary simplification but may not capture the full complexity of live reservoir fluids that contain solution gas, asphaltenes, and brine. Extrapolating pilot-plant results to field behavior requires careful compositional modeling.
Safety and Complexity of High-Pressure Operation
Working with flammable crude oil and high-pressure CO₂ introduces process safety risks. Pilot plants need robust relief systems, gas detection, and rigorous standard operating procedures. This complexity demands trained operators and can limit the pace of experimentation compared to ambient-pressure benchwork.
Scale-Up from Capillary to Reservoir
Viscosity numbers from a pilot plant are bulk properties measured in idealized geometries. In a real reservoir, heterogeneity, wettability, and fracture networks dominate flow. The measured viscosity is essential but must be fed into reservoir simulators—it is not a direct predictor of ultimate recovery on its own.
How to Apply This to Your Project
Your design and execution will depend on your primary objective. Use the pilot plant’s flexibility to focus on the metrics that matter most.
- If your primary focus is screening EOR candidates for a field pilot: Generate full viscosity-pressure and swelling curves for multiple oil samples, prioritizing the minimum miscibility pressure and the mobility ratio improvement at that pressure.
- If your primary focus is undergraduate or graduate chemical engineering education: Have students operate the PVT cell and explain how each measured property (viscosity, density, swelling) directly connects back to core unit operations principles like pressure drop, Reynolds number, and phase equilibria.
- If your primary focus is fundamental fluid property research: Use the pilot plant to isolate the effect of specific crude oil fractions (saturates vs. aromatics) on CO₂-induced viscosity reduction, potentially integrating asphaltene precipitation monitoring to understand the full thermodynamic envelope.
A well-designed pilot-plant study transforms CO₂-crude oil viscosity reduction from a textbook concept into a measurable, predictable engineering variable—empowering you to make confident decisions about gas-injection EOR.
Summary Table:
| Key Parameter | Measurement Method | Impact on EOR & Operations |
|---|---|---|
| Viscosity Reduction | High-pressure Viscometers | Improves mobility ratio; reduces pumping pressure drop. |
| CO2 Solubility | PVT Cells (constant T & P) | Minimizes gravity override; matches gas-oil densities. |
| Volumetric Swelling | Density/Visual PVT analysis | Sweeps residual oil from dead-end pores. |
Accelerate Your Research and Training with LABPARK
Are you looking to equip your laboratory with advanced testing capabilities? LABPARK provides state-of-the-art Educational and Vocational Unit Operations Pilot Plants in chemical engineering, bioprocess & biotech, and environmental & water treatment.
Designed specifically for universities, research institutes, and enterprises, our systems deliver the high-pressure precision and reliability required to model complex reservoir behaviors, train the next generation of engineers, and optimize chemical processes.
Ready to elevate your research efficiency? Contact LABPARK today to discuss your pilot plant requirements!
Related Products
- Carbon Dioxide PVT Curve Determination Educational Unit Operations Pilot Plant
- Bench Scale Carbon Dioxide Capture Educational Unit Operations Pilot Plant
- Low Concentration Carbon Dioxide Capture Pressure Swing Adsorption Educational Pilot Plant
- Carbon Dioxide Absorption and Desorption Educational Pilot Plant for Carbon Capture Studies
- Dual-Mode Gas Absorption and Desorption Unit Operations Training Pilot Plant
People Also Ask
- How do temperature variations affect CO2 transport models in pilot plants? Model vs Reality
- What unit operations are critical for CCUS training pilot plants? Build hands-on engineering expertise.
- What key thermodynamic properties & engineering challenges affect scCO2 reactions in pilot plants?
- How are titration curves used in pilot plants? Guide to process control & endpoint accuracy
- What are the applications and limitations of the Virial EOS? Enhance Your Pilot Plant Lab