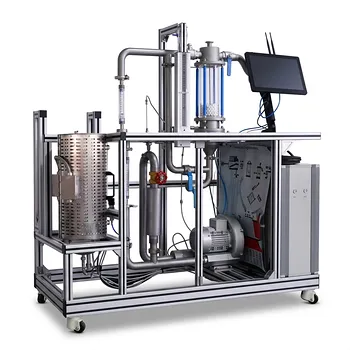
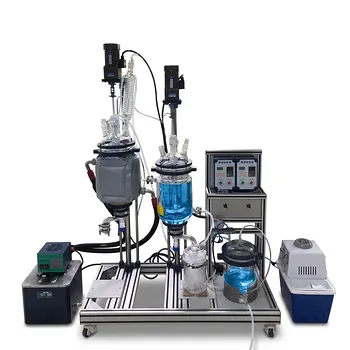
Regular perturbation analysis is used because it converts a difficult nonlinear heat-transfer model into a sequence of simpler linear problems. When thermal conductivity, electrical conductivity, viscosity, density, or heat-generation terms vary mildly with temperature, the variation can be represented using a small dimensionless parameter, (\varepsilon). Expanding temperature and material properties in powers of (\varepsilon) produces a baseline solution and successive corrections that describe the effect of temperature dependence.
Regular perturbation analysis provides a fast, interpretable approximation of pilot-plant temperature and heat-transfer behavior while retaining the leading effects of variable material properties.
Why Temperature-Dependent Properties Create Modeling Difficulty
Constant-property models are often incomplete
Many introductory heat-transfer models assume that thermal conductivity and other transport properties remain constant. That assumption can be adequate over a narrow temperature range, but it becomes less reliable when pilot-plant equipment experiences meaningful temperature gradients.
For example, a thermal conductivity model may take the form
[ k(T)=k_0(1+\beta T) ]
for a plane wall, or include higher-order terms such as
[ k(T)=k_0(1+\alpha T+\beta T^2) ]
for cylindrical or spherical systems.
Variable conductivity makes the energy equation nonlinear
With temperature-dependent conductivity, the conductive heat flux depends on both temperature and its gradient:
[ q=-k(T)\frac{dT}{dx}. ]
Substituting this relation into the energy balance creates a nonlinear differential equation. Similar nonlinearities arise when viscosity, density, specific heat, electrical resistance, or internal heat-generation terms depend on temperature.
Pilot plants need more than a single temperature prediction
Pilot plants are used to assess operating behavior, calibrate models, and guide scale-up. Engineers therefore need to understand not only the predicted temperature field, but also how changes in material properties affect heat flux, wall shear, energy input, and process control.
A method that exposes these relationships analytically can be more useful for interpretation than a numerical result alone.
How Regular Perturbation Simplifies the Model
A small parameter measures property variation
The method begins by identifying a small dimensionless parameter (\varepsilon), such as a relative temperature difference or a property-variation coefficient. The assumption is that
[ \varepsilon \ll 1, ]
so temperature-dependent effects act as corrections to a dominant constant-property problem.
For example, a dimensionless temperature can be expanded as
[ \theta=\theta_0+\varepsilon\theta_1+\varepsilon^2\theta_2+\cdots. ]
The property models are expanded consistently.
The nonlinear equation becomes a hierarchy of linear equations
After substituting the expansions into the governing energy, momentum, or transport equations, terms are grouped by powers of (\varepsilon). This produces separate equations for:
- (O(1)): the constant-property baseline;
- (O(\varepsilon)): the leading correction from property variation;
- (O(\varepsilon^2)) and higher: increasingly refined corrections.
Each equation is solved sequentially. The leading solution is obtained first, then used to determine the first correction, and so on.
The baseline solution gives physical context
The (O(1)) solution describes the temperature field that would result if the relevant properties were constant. This establishes a reference against which the effects of temperature dependence can be measured.
The first-order term then shows how variable conductivity or another temperature-sensitive property modifies that reference state.
What Engineers Gain from the Approximation
Faster evaluation of internal temperature fields
A perturbation solution can provide rapid estimates of temperature profiles in heated elements, packed beds, and heat-exchange units. This is valuable during pilot-plant operation, where repeated calculations may be needed for different operating conditions.
It can also support telemetry analysis by allowing measured temperature changes to be compared with an analytical model without invoking a full numerical simulation for every case.
Direct insight into property sensitivity
The correction terms reveal how strongly the solution responds to a particular property variation. In boundary-layer and convective heat-transfer models, separate property sensitivities can be used to estimate the effects of changes in viscosity, density, thermal conductivity, or specific heat.
This helps distinguish whether a change in heat-transfer coefficient, Nusselt number, or wall shear is primarily associated with one property or with the combined effect of several properties.
Analytical estimates of engineering quantities
The method can be used to approximate quantities such as:
- temperature distributions;
- heat flux;
- energy input requirements;
- skin-friction coefficients;
- Nusselt numbers;
- deviations from constant-property predictions.
These results support equipment evaluation, model calibration, and operating-condition studies.
A practical bridge between simple and full models
Constant-property models are often too limited, while computational fluid dynamics can require substantial computational effort and detailed input data. Regular perturbation analysis occupies a useful middle ground.
It retains a first-order representation of important physical effects while remaining transparent enough for engineering interpretation and classroom instruction.
Why the Method Is Especially Useful in Pilot-Plant Work
Pilot plants combine changing conditions with limited data
Pilot equipment often operates over conditions that differ from idealized laboratory tests. Temperature gradients, electrical heating, fluid motion, and material-property changes occur simultaneously, while available measurements may be limited to selected locations.
A perturbation model can use the available measurements to estimate the effect of property variations throughout the system.
The method supports model calibration
Because the solution is separated into a baseline and correction terms, experimental deviations from a constant-property prediction can be related to specific sensitivity coefficients or property models.
This structure makes it easier to identify whether the assumed temperature dependence is plausible and whether the model requires refinement.
It improves process understanding
In educational and research environments, sequential perturbation equations show how each physical effect enters the governing model. Students and researchers can see the relationship between a property change and its consequence for temperature, heat flux, or flow behavior.
That explanatory value is difficult to obtain from a numerical solver that only returns a final field.
Understanding the Trade-offs
The small-parameter assumption limits applicability
Regular perturbation analysis is most reliable when temperature-dependent effects are relatively mild. If (\varepsilon) is not small, higher-order terms may become important, and a truncated series may no longer represent the actual solution accurately.
For strongly nonlinear behavior, numerical methods or another asymptotic technique may be more appropriate.
The expansion may not capture every physical regime
A regular power series assumes that the solution can be represented smoothly around the selected baseline. It may perform poorly near singularities, sharp thermal transitions, phase changes, or regimes involving multiple distinct scales.
The method should therefore be checked against physical operating limits and, where necessary, numerical or experimental results.
Simplifying property laws introduce model error
A relation such as (k=k_0(1+\beta T)) is an approximation to measured material behavior. Its accuracy depends on the temperature range, material, geometry, and reference state.
Even a mathematically accurate perturbation solution can be misleading if the underlying property correlation is unsuitable.
Truncation creates a controlled but nonzero error
Keeping only (O(1)) and (O(\varepsilon)) terms is often practical, but it omits higher-order effects. Engineers should assess whether the first-order correction is sufficiently small and whether adding the next term materially changes the prediction.
Perturbation results are best treated as validated approximations rather than universally exact solutions.
Making the Right Choice for Your Goal
Use regular perturbation analysis when its assumptions match the operating regime and when analytical insight is important.
- If your primary focus is rapid pilot-plant analysis: Use a first- or second-order perturbation model to estimate temperature fields and heat-transfer behavior with low computational cost.
- If your primary focus is understanding property effects: Separate the perturbation contributions to quantify how conductivity, viscosity, density, or specific heat changes influence the result.
- If your primary focus is model calibration: Compare the baseline and correction terms with pilot-plant measurements to evaluate the assumed temperature-property relationships.
- If your primary focus is strongly nonlinear or wide-range operation: Use perturbation analysis as an initial estimate, then verify it with a nonlinear numerical model or experimental data.
Regular perturbation analysis helps engineers retain the essential effects of temperature-dependent properties while keeping pilot-plant models solvable, interpretable, and computationally efficient.
Summary Table:
| Aspect | Key insight |
|---|---|
| Main purpose | Converts nonlinear heat-transfer equations into sequential linear problems |
| Best operating range | Mild temperature-dependent property variations with a small dimensionless parameter |
| Core output | Baseline solution plus first- and higher-order correction terms |
| Engineering uses | Predict temperature fields, heat flux, energy input, Nusselt numbers, and wall shear |
| Pilot-plant value | Supports rapid analysis, model calibration, scale-up, and process understanding |
| Key limitation | Requires validation when behavior is strongly nonlinear, wide-ranging, or near phase transitions |
Need a clearer way to evaluate heat-transfer behavior before scale-up? Contact LABPARK to discuss Educational and Vocational Unit Operations Pilot Plants for chemical engineering, bioprocess and biotech, and environmental and water-treatment applications. LABPARK helps universities, research institutes, and enterprises study temperature-dependent properties through practical pilot-plant experiments, generate data for model calibration, compare analytical predictions with real operating results, and improve process design and training. Our modular systems support hands-on investigation of heat transfer, energy use, fluid behavior, and scale-up decisions in a controlled, application-focused environment.
Related Products
- Comprehensive Multi-Modal Heat Transfer Unit Operations Pilot Plant for Engineering Training
- Dual Mode Heat Transfer Pilot Plant for Unit Operations Training
- Solid Spherical Heat Transfer Coefficient Determination Educational Chemical Engineering Pilot Plant
- Three-Tube Heat Transfer Educational Pilot Plant for Unit Operations Training
- Shell and Tube Heat Exchanger Heat Transfer Coefficient Determination Educational Pilot Plant
People Also Ask
- Why is the study of thermal boundary layers and Prandtl numbers critical in heat transfer unit operations pilot plants?
- When is ε-NTU preferred over LMTD in pilot plants? Predict heat exchanger performance without iteration.
- Why monitor temperature correction factor (Ft) in pilot plants? How to handle values below 0.75
- Why is emissivity critical in heat transfer pilot plants? Bridge the Gap Between Theory & Industrial Design
- How does regular perturbation analysis aid in predicting nonlinear temperature distributions? Pilot plant insights