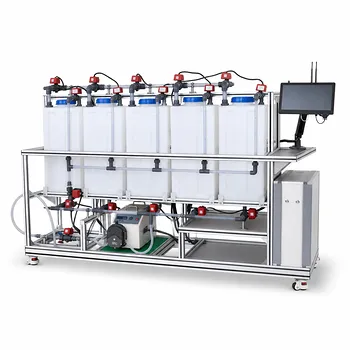
The clearest educational benchmarks are saponification of ethyl acetate and the reaction of ethylene bromide with potassium iodide. Both are commonly treated as bimolecular, second-order reactions, whereas a zero-order reaction has a rate independent of reactant concentration. This difference changes the integrated rate equation, rate-constant units, half-life behavior, and the way students interpret batch or continuous pilot-unit data.
Second-order reactions slow as reactants are consumed; zero-order reactions proceed at a constant rate as long as the zero-order regime remains valid. In an educational pilot unit, this contrast demonstrates how concentration dependence affects reaction-time prediction, reactor sizing, and kinetic-data analysis.
Benchmark Second-Order Reactions in Educational Pilot Units
Saponification of ethyl acetate
The standard example is the alkaline hydrolysis, or saponification, of ethyl acetate:
[ \mathrm{CH_3COOC_2H_5 + OH^- \rightarrow CH_3COO^- + C_2H_5OH} ]
The reaction is commonly modeled as:
[ -r_A = k C_{\text{ester}} C_{\text{OH}^-} ]
This is a second-order rate law overall, because the rate depends on the concentration of two reactants.
When ethyl acetate and hydroxide are introduced at equal initial concentrations and react in a 1:1 stoichiometric ratio, their concentrations remain equal during the reaction. The rate expression then simplifies to:
[ -r_A = k C_A^2 ]
Conductivity as a teaching measurement
Saponification is especially useful in teaching pilot units because its progress can be followed using electrical conductivity.
Highly conductive hydroxide ions are consumed and replaced by acetate ions, which have lower molar conductivity. The resulting decrease in conductivity provides an indirect measurement of reactant conversion.
Students can compare the initial conductivity, the conductivity at time (t), and the final conductivity after effectively complete reaction. These measurements can be converted into concentration or conversion data for determining the second-order rate constant.
Reaction of ethylene bromide and potassium iodide
A second benchmark is the reaction between ethylene bromide and potassium iodide in approximately 99% methanol.
It is used as an example of a bimolecular reaction because the rate depends on the interaction of the two reacting species. In a simplified kinetic treatment, the rate is represented as:
[ -r_A = k C_A C_B ]
If the reactants are prepared at equal initial concentrations, the expression can again reduce to an equal-concentration second-order form proportional to (C_A^2).
This experiment complements the saponification system by showing that second-order behavior is not limited to aqueous ionic reactions.
How Second-Order Kinetics Differ from Zero-Order Kinetics
Rate dependence on concentration
For a second-order reaction involving two reactants:
[ -r_A = k C_A C_B ]
The reaction rate decreases as either reactant is consumed. If both concentrations decrease substantially, the rate can fall sharply during a batch experiment.
For an equal-concentration second-order reaction:
[ -r_A = k C_A^2 ]
The squared concentration dependence makes the rate particularly sensitive to changes in concentration.
For a zero-order reaction:
[ -r_A = -\frac{dC_A}{dt}=k ]
The rate is independent of reactant concentration within the operating range where the zero-order approximation applies.
Integrated batch-reactor equations
For an equal-concentration second-order reaction:
[ \frac{1}{C_A}-\frac{1}{C_{A0}}=kt ]
Using conversion (X_A), the same relationship can be written as:
[ \frac{X_A}{C_{A0}(1-X_A)}=kt ]
The reciprocal concentration therefore varies linearly with time for this second-order model.
For a zero-order reaction:
[ C_{A0}-C_A=kt ]
or:
[ C_{A0}X_A=kt ]
Here, the concentration consumed increases linearly with time. A plot of (C_{A0}-C_A) against (t) should be linear, with slope (k).
Rate-constant units
The units provide a useful diagnostic distinction.
For a second-order rate law:
[ k \sim \frac{\text{volume}}{\text{amount}\cdot\text{time}} ]
For a zero-order rate law:
[ k \sim \frac{\text{amount}}{\text{volume}\cdot\text{time}} ]
In laboratory units, these may appear as (\mathrm{L,mol^{-1},time^{-1}}) for a second-order constant and (\mathrm{mol,L^{-1},time^{-1}}) for a zero-order constant.
Half-life behavior
For an equal-concentration second-order reaction:
[ t_{1/2}=\frac{1}{kC_{A0}} ]
The half-life decreases when the initial concentration increases.
For a zero-order reaction:
[ t_{1/2}=\frac{C_{A0}}{2k} ]
The zero-order half-life increases with initial concentration. This is an important teaching contrast: the second-order half-life is inversely proportional to initial concentration, while the zero-order half-life is directly proportional to it.
What Students Learn from Pilot-Unit Comparisons
Concentration affects reactor time differently
In a second-order batch reaction, the initial stage can be relatively fast because reactant concentrations are high. The reaction then slows progressively as the concentrations fall.
In a zero-order batch reaction, the concentration decreases at a constant rate. The time required to consume a specified concentration interval is therefore constant for a given (k).
Reactor sizing depends on the kinetic model
The kinetic expression determines how much reactor volume or residence time is required to reach a target conversion.
A second-order model predicts increasing difficulty in achieving additional conversion because the reaction becomes slower at lower concentration. A zero-order model predicts a linear relationship between concentration change and processing time within the valid kinetic regime.
Data plots reveal the likely reaction order
For saponification or another equal-concentration second-order system, students can test linearity by plotting:
[ \frac{1}{C_A} \quad \text{against} \quad t ]
For a zero-order system, they can plot:
[ C_{A0}-C_A \quad \text{against} \quad t ]
The plot that gives the stronger linear relationship supports the corresponding kinetic model, although temperature control, mixing, measurement error, and concentration calibration must also be considered.
Understanding the Trade-offs
A second-order model may depend on stoichiometric conditions
The simplified equation ( -r_A=kC_A^2 ) applies most directly when the two reactants have equal initial concentrations and react in equal stoichiometric proportions.
If the initial concentrations are unequal, the more general expression ( -r_A=kC_A C_B ) should be retained. Treating every bimolecular reaction as (kC_A^2) can produce an incorrect rate constant.
Zero-order behavior is usually a regime, not a universal mechanism
Zero-order kinetics often describe a condition in which the controlling reactive sites or another rate-limiting feature are saturated. For example, heterogeneous catalytic surfaces can become saturated, making further increases in reactant concentration ineffective over a particular operating range.
This does not mean the reaction is concentration-independent under all temperatures, pressures, or compositions. Pilot-unit data should be checked for the range over which the zero-order approximation remains valid.
Apparent order can change with operating conditions
Non-elementary reactions can exhibit different apparent orders in different concentration regimes. Active intermediates, deactivation, or competing steps can cause a reaction to appear second-order at low concentration and closer to first-order at high concentration.
Students should therefore distinguish an experimentally observed apparent reaction order from a universal mechanistic statement.
Conductivity requires careful interpretation
Conductivity is a practical online measurement for saponification, but it is an indirect concentration measurement. The relationship between conductivity and concentration must be established consistently, and the initial and final conductivity values must be measured reliably.
Temperature variation is also important because conductivity is temperature-sensitive. Poor mixing or sensor placement can introduce additional error into the inferred kinetics.
How to Apply This to Your Project
Use the kinetic model that matches both the reaction chemistry and the experimental data.
- If your primary focus is demonstrating second-order kinetics: Use ethyl acetate saponification or ethylene bromide–potassium iodide, monitor concentration or conductivity over time, and test a reciprocal-concentration plot for linearity.
- If your primary focus is demonstrating zero-order kinetics: Plot (C_{A0}-C_A) against time and verify that the slope is approximately constant over the selected operating range.
- If your primary focus is reactor sizing: Use the integrated rate equation appropriate to the verified reaction order rather than assuming that all batch reactions have constant rates.
- If your primary focus is comparing pilot-unit experiments: Keep temperature, mixing, initial concentrations, and measurement methods controlled so that differences in concentration dependence are not confused with equipment effects.
Understanding whether the rate decreases with concentration or remains constant is the foundation for interpreting reaction-time data and designing reliable educational pilot-unit experiments.
Summary Table:
| Feature | Second-order reaction | Zero-order reaction |
|---|---|---|
| Benchmark | Ethyl acetate saponification; ethylene bromide with potassium iodide | Saturated or rate-limited reaction regime |
| Rate law | -rA = kCA CB; often -rA = kCA^2 for equal concentrations | -rA = k |
| Batch relationship | 1/CA - 1/CA0 = kt | CA0 - CA = kt |
| Rate behavior | Slows as reactants are consumed | Remains constant within the valid regime |
| Rate-constant units | Volume/(amount x time), such as L mol-1 time-1 | Amount/(volume x time), such as mol L-1 time-1 |
| Half-life | t1/2 = 1/(kCA0); decreases as initial concentration rises | t1/2 = CA0/(2k); increases as initial concentration rises |
| Recommended data plot | 1/CA versus time | CA0 - CA versus time |
| Teaching measurement | Conductivity can track hydroxide consumption during saponification | Concentration measurements should confirm a constant-rate regime |
Planning an educational reaction engineering laboratory or pilot unit? Contact LABPARK to discuss your requirements. LABPARK provides Educational and Vocational Unit Operations Pilot Plants for chemical engineering, bioprocess and biotechnology, and environmental and water treatment applications. Our systems help universities, research institutes, and enterprises teach and validate reaction kinetics through controlled batch or continuous experiments, concentration and conductivity measurements, reactor-sizing studies, and repeatable data analysis. We can help you select a configuration for demonstrating second-order and zero-order behavior, match instrumentation to your curriculum or research goals, and develop a practical pilot-unit solution for reliable training and process evaluation.
Related Products
- Multi-Reactor Educational Pilot Plant for Reaction Engineering Unit Operations
- Fixed Bed Gas Solid Catalytic Reaction Educational Pilot Plant
- Fixed-Bed Chemical Reaction and Gas Dust Tar Removal Unit Operations Pilot Plant
- Multi-Functional Special Distillation Educational Pilot Plant
- Tubular Reactor Flow Characteristics Determination Educational Unit Operations Pilot Plant
People Also Ask
- How do reactor pilot plants define QbD design space? Master chemical process scale-up.
- When configuring a reactor unit operations pilot plant for highly exothermic reactions, how to prevent thermal runaway?
- How do metal ion-catalyzed reaction mechanisms inform chemical engineering pilot plant design? From kinetics to scale-up
- What are the barriers to process intensification & how do pilot plants help?
- What role do educational pilot plants play in scaling green chemistry? Bridging the Lab-to-Industry Gap