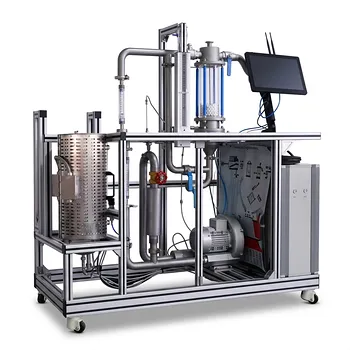
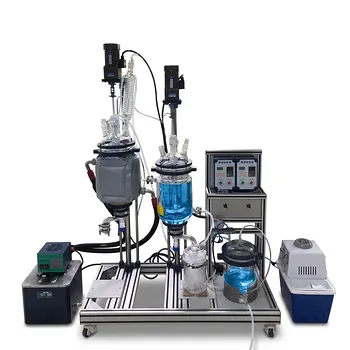
When a pilot plant heat exchanger is already built and its internal geometry is fixed, evaluating its thermal performance demands a method that handles unknown outlet temperatures without iterative guesswork. The epsilon-NTU (ε-NTU) method is that tool. In chemical engineering laboratory education, students apply the ε-NTU method to rate and verify heat exchanger performance by directly calculating the heat transfer effectiveness and comparing it against what theory predicts for that unit’s configuration and operating conditions.
A pilot plant heat exchanger’s performance is evaluated not by designing a new one, but by checking how close its real thermal behavior comes to the ideal. The ε‑NTU method makes this straightforward: students measure inlet conditions, compute the actual effectiveness, and then read the expected effectiveness from the unit’s known NTU and flow arrangement. The gap between them reveals real-world deviations such as fouling, flow maldistribution, or model inaccuracies.
Why the ε-NTU Method is the Go-To Tool for an Existing Exchanger
The Problem with Unknown Outlet Temperatures
When a pilot plant exchanger is already installed, its heat transfer area and internal geometry are fixed.
In a typical lab exercise, students can set the inlet temperatures and flow rates—but the outlet temperatures are the unknowns they need to predict or verify.
The classical Log Mean Temperature Difference (LMTD) method is simple if all four terminal temperatures are known.
However, using LMTD to solve for an unknown outlet temperature requires a tedious, iterative trial-and-error loop because the LMTD itself is defined by those very same outlet temperatures.
A Direct, Iteration-Free Path
The ε-NTU method circumvents this impasse.
By relating heat transfer effectiveness (ε)—the ratio of actual heat transfer to the maximum thermodynamically possible heat transfer—to the dimensionless Number of Transfer Units (NTU), the method allows direct calculation of outlet temperatures or a direct comparison of measured vs. predicted performance.
In an educational setting, this means students can analyze multiple operating points quickly, without coding iterative solvers, and focus on understanding the underlying thermal physics.
The approach is inherently suited to rating and verification, exactly the task at hand when the exchanger already exists.
Step-by-Step Application of ε-NTU in the Laboratory
Step 1: Collect the Raw Data
The experiment begins with a pilot plant exchanger instrumented to measure:
- Inlet and outlet temperatures of both the hot and cold fluids.
- Flow rates of both streams (to compute heat capacity rates).
Flow configuration (counter-flow, parallel-flow, shell-and-tube with a known number of passes) is recorded because the ε‑NTU relationship depends strongly on it.
Step 2: Calculate the Measured Effectiveness
From the measured temperatures and flow rates, students compute:
- The heat capacity rates of the hot and cold streams: ( C_h = \dot{m}h c{p,h} ), ( C_c = \dot{m}c c{p,c} ).
- The smaller of the two, ( C_{\text{min}} ), and the heat capacity rate ratio ( C_r = C_{\text{min}} / C_{\text{max}} ).
Next, they calculate the actual heat transfer rate ( Q ) from either the hot or cold side (ideally both, as a consistency check).
The maximum possible heat transfer rate is:
[ Q_{\text{max}} = C_{\text{min}} \left( T_{\text{hot,in}} - T_{\text{cold,in}} \right) ]
The measured effectiveness is then simply:
[ \epsilon_{\text{exp}} = \frac{Q}{Q_{\text{max}}} ]
Step 3: Determine the Exchanger’s NTU
To evaluate performance, students need the exchanger’s NTU under the experimental conditions.
This requires the overall heat transfer coefficient ( U ) and the heat transfer area ( A ):
[ NTU = \frac{U A}{C_{\text{min}}} ]
In a pilot plant lab, ( A ) is known from the equipment specifications.
The overall coefficient ( U ) may be obtained in one of two ways:
- From the manufacturer’s clean-design value (if the goal is to detect fouling).
- By calculating ( U ) from the experimental data itself, using the actual ( Q ), the LMTD computed from the measured temperatures, and the known area. This yields the ( U ) that truly prevailed during the run.
Using the experimentally determined ( U ) turns the analysis into a check of whether the data align with the theoretical ε‑NTU curve for that flow arrangement and ( C_r ).
Step 4: Compare with the Theoretical ε‑NTU Model
With ( NTU ) and ( C_r ) in hand, students turn to the standard ε‑NTU chart or equation for the exchanger’s flow configuration (e.g., counter-flow: ( \epsilon = \frac{1 - \exp[-NTU(1-C_r)]}{1 - C_r \exp[-NTU(1-C_r)]} ) for ( C_r<1 )).
They read off the theoretical effectiveness ( \epsilon_{\text{theo}} ) that the exchanger should deliver under these exact inlet conditions and flow rates.
The ratio ( \epsilon_{\text{exp}} / \epsilon_{\text{theo}} ) becomes a direct performance indicator.
What the Comparison Tells You About the Exchanger
Evaluating Real-World Behavior
If ( \epsilon_{\text{exp}} ) falls significantly below ( \epsilon_{\text{theo}} ), the exchanger is underperforming.
This can point to:
- Fouling on the heat transfer surface, reducing ( U ).
- Flow maldistribution causing parts of the area to be less effective.
- Inaccuracies in the assumed flow arrangement (e.g., the unit may behave more like a mixed flow than pure counter‑flow).
In a teaching lab, this transforms a simple data‑collection exercise into a diagnostic investigation—students must hypothesize why the deviation occurred and, often, inspect the exchanger for visible fouling or measure pressure drops as supporting evidence.
Verifying the Theoretical Model Itself
When a clean pilot plant is used under carefully controlled conditions, the measured effectiveness should lie on the theoretical curve.
In this case, the ε‑NTU method serves as a hands-on validation of the textbook correlations, reinforcing the connection between abstract NTU equations and physical process hardware.
Students can deliberately vary the flow rates to change ( C_r ) and ( NTU ), plot the resulting ( \epsilon_{\text{exp}} ) points on the same graph as the theoretical curve, and discuss the agreement—or the lack thereof—due to heat losses or measurement uncertainty.
Understanding the Trade-offs
Reliance on a Known or Accurately Measured U
The power of the ε‑NTU performance check hinges on the accuracy of the overall heat transfer coefficient, ( U ).
A design‑book value assumes clean surfaces and idealized flow; using it with a fouled exchanger will over‑predict ( NTU ) and make the deviation appear even larger than it is.
Laboratories therefore often teach students to compute ( U ) from the experimental data before calculating ( NTU ), which ties the analysis directly to the observed heat transfer.
Sensitivity to Flow Configuration Assumptions
Small deviations from the assumed flow pattern—such as a shell-and-tube unit with unexpected bypassing—can shift the ε‑NTU curve.
Students must learn that the method is not a black box; it demands a correct physical description of the exchanger’s internal flow arrangement.
Not a Replacement for a Full Energy Balance
The ε‑NTU method evaluates thermal performance, but it does not replace a rigorous energy balance.
Students should always verify that the heat duty computed from the hot side matches that from the cold side within an acceptable closure error. A large closure error may indicate a measurement fault that will skew the effectiveness calculation.
Making the Right Choice for Your Educational Goal
How you deploy the ε‑NTU method in a pilot plant lab depends on the learning outcome you have in mind. Consider these targeted approaches:
- If your primary focus is demonstrating the ε‑NTU theory: Design the experiment so that students plot ( \epsilon_{\text{exp}} ) against ( NTU ) for various flow rates and overlay the theoretical curve for the exchanger’s flow configuration. The discussion should center on why the points follow (or deviate from) the curve.
- If your primary focus is performance evaluation and fouling detection: Supply a clean‑design value of ( U ) and ( A ), and have students compare the resulting ( \epsilon_{\text{theo}} ) to the measured effectiveness. The discrepancy becomes a quantifiable measure of degradation, and you can extend the lab to include cleaning the exchanger and re‑testing.
- If your primary focus is iterative‑free prediction of outlet conditions: Pose a scenario where only inlet temperatures and a new set of flow rates are known. Students use the ε‑NTU method to directly predict the two outlet temperatures and then verify their predictions by actually running the pilot plant at those conditions.
By mastering the ε‑NTU method, students gain not just a computational recipe but a clear mental model for how real heat exchangers translate physical design parameters into thermal performance—precisely the bridge between theoretical knowledge and practical engineering judgment.
Summary Table:
| Step | Key Action | Objective |
|---|---|---|
| 1. Collect Data | Measure flow rates & inlet/outlet temperatures | Establish baseline operating conditions |
| 2. Calculate Effectiveness | Compute actual vs. maximum possible heat transfer | Find measured effectiveness ($\epsilon_{\text{exp}}$) |
| 3. Determine NTU | Calculate $NTU = UA / C_{\text{min}}$ using known area | Quantify thermal size under test conditions |
| 4. Compare Models | Compare experimental vs. theoretical effectiveness | Identify fouling, maldistribution, or heat loss |
Equip Your Lab for Practical Engineering Excellence
Bring theoretical thermodynamics to life with LABPARK. We provide state-of-the-art Educational and Vocational Unit Operations Pilot Plants in chemical engineering, bioprocess & biotech, and environmental & water treatment. Designed specifically for universities, research institutes, and enterprises, our systems give students and researchers hands-on experience with industrial-grade heat exchangers and process control hardware.
Ready to elevate your laboratory training capabilities? Contact LABPARK today to discuss your custom pilot plant needs and get a tailored solution!
Related Products
- Shell and Tube Heat Exchanger Heat Transfer Coefficient Determination Educational Pilot Plant
- Dual Mode Heat Transfer Pilot Plant for Unit Operations Training
- Comprehensive Multi-Modal Heat Transfer Unit Operations Pilot Plant for Engineering Training
- Three-Tube Heat Transfer Educational Pilot Plant for Unit Operations Training
- Comprehensive Heat Transfer Coefficient Determination Educational Unit Operations Pilot Plant
People Also Ask
- Why Apply LMTD Correction in Shell-and-Tube Pilot Plants & How to Determine It
- Why adjust baffle spacing in shell-and-tube heat exchanger pilot plants? Master heat transfer & pressure drop.
- How to Estimate Shell-Side Pressure Drop in a Shell-and-Tube Heat Exchanger Pilot Plant: Key Parameters Explained
- How is the fouling factor (Rd) evaluated? Key Pilot Plant Insights for Students
- How is fouling factor demonstrated using shell and tube pilot plants? Practical Lab Guide