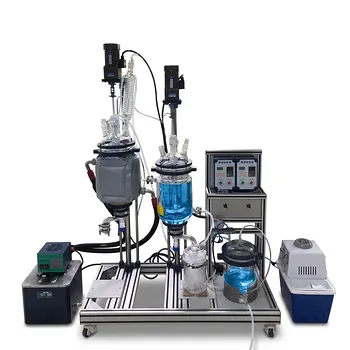
At its core, the McCabe–Thiele method is a graphical translation of a binary mixture's thermodynamics into a precise count of theoretical separation stages. For a distillation pilot plant, applying this method begins with plotting the vapor–liquid equilibrium (VLE) curve, then drawing the rectifying and stripping operating lines based on material balances and the chosen reflux ratio. By injecting the feed condition through the q‑line, you step off rectangular stages between the operating lines and the equilibrium curve. The number of steps (minus one if the reboiler is excluded) gives the theoretical plates required for the target separation. Simultaneously, the construction yields critical design parameters such as the minimum reflux ratio, optimal feed tray location, and the benchmark needed to calculate real column efficiency.
The McCabe‑Thiele method serves as both a design instrument and an analytical benchmark. On a pilot plant, it converts a target separation into a tangible stage count, then lets you compare that ideal with the actual physical trays or packing height—revealing the overall efficiency that governs real-world mass transfer.
The Graphical Foundation: From Equilibrium to Operating Lines
The method’s power lies in its systematic layering of equilibrium thermodynamics and material balances onto a single diagram.
Constructing the Vapor–Liquid Equilibrium Curve
Begin with the x‑y equilibrium data for the binary mixture. Plot the liquid mole fraction of the more volatile component (x) against its vapor mole fraction (y), producing a curve that sits above the 45‑degree diagonal. This curve defines the composition achievable by one perfect theoretical contact stage. The greater its curvature away from the diagonal, the easier the separation.
The Rectifying Section Operating Line
Above the feed point, the rectifying operating line represents a material balance around the top of the column and the condenser. Starting from the distillate composition coordinate (x_D, x_D) on the diagonal, the line slopes downward with a gradient equal to L/V (the internal liquid-to-vapor ratio). The slope is directly tied to the reflux ratio: slope = R / (R + 1). A higher reflux makes the line steeper, pushing operating conditions farther from the equilibrium curve and reducing the number of stages required.
The Stripping Section and the q‑Line
Below the feed, the stripping operating line describes the mass balance around the reboiler and the bottom stages. It starts from the bottoms composition (x_W, x_W) and its slope reflects the vapor and liquid traffic in that section, adjusted by the feed thermal condition.
The q‑line (feed line) bridges the two operating lines. Its slope is determined by the feed’s liquid fraction q: “saturated liquid” yields a vertical line, “saturated vapor” a horizontal one, and partial vaporization an intermediate slope. The point where the q‑line intersects both operating lines is the optimal feed stage location in graphical stepping.
Stepping Off Theoretical Stages
Once the equilibrium curve and both operating lines are in place, you begin at (x_D, x_D) and descend in rectangular steps: a horizontal move to the equilibrium curve, then a vertical drop to the operating line, repeating until dropping below (x_W, x_W). Each triangle‑shaped step represents one theoretical stage. The total number of steps (including the reboiler’s contribution) is the theoretical plate count n. If counting plates only, subtract one. This stepping procedure yields the design parameter “number of theoretical plates” for the given reflux and feed condition.
Linking Theory to the Pilot Plant: Parameters Beyond Stage Count
The McCabe‑Thiele construction does more than count stages—it reveals the boundary conditions for energy input and stream placement.
Determining Minimum Reflux Ratio and Optimal Reflux
When the rectifying operating line is drawn so that it touches the equilibrium curve at the point where the q‑line intersects, the slope reaches its minimum possible value—this defines the minimum reflux ratio. Operating at this ratio would require an infinite number of stages. In a pilot plant, you deliberately select an operating reflux ratio some multiple (often 1.2 to 1.5) above the minimum to strike a balance between capital cost (column height) and operating cost (reboiler duty). The McCabe‑Thiele plot visualizes this trade‑off instantly.
Pinpointing the Optimal Feed Tray Location
The stepping transition from the rectifying to the stripping operating line should occur at the stage that straddles the intersection of the q‑line with the two operating lines. Feeding at exactly this location minimizes the total theoretical stages—if you feed too high or too low, the required stage count increases, and product purity may suffer. In a pilot plant, students can physically change the feed entry and observe how off‑optimal placement forces higher reflux or reduces separation, cementing the link between the diagram and energy consumption.
From Ideal Stages to Real Tray Efficiency
The theoretical stage count assumes perfect equilibrium on every tray—a condition never encountered in practice.
Why Actual Trays Fall Short of Theory
On a physical tray (sieve, bubble cap, or valve), vapor and liquid contact is limited by hydrodynamics, mixing, and mass transfer resistance. Consequently, the composition leaving an actual tray deviates from the equilibrium curve; the actual separation achieved per tray is always less. This gap is what makes the McCabe‑Thiele method an essential diagnostic tool, not an absolute prescription.
Calculating Overall Column Efficiency
After operating the pilot plant at steady state, you can measure compositions of distillate, bottoms, and intermediate sample ports. Re‑plot the actual operating path and compare the number of theoretical stages required (from the McCabe‑Thiele diagram) to the number of physical trays installed. The overall column efficiency is simply η = (theoretical stages / actual stages) × 100%. This efficiency captures the combined effects of tray design, vapor velocity, and liquid loads.
HETP for Packed Columns
For packed columns, the theoretical stage count is converted into a height via the Height Equivalent to a Theoretical Plate (HETP). By dividing the packed height by the number of theoretical stages from the McCabe‑Thiele diagram, you obtain HETP. A smaller HETP indicates a more efficient packing—critical for scale‑up decisions.
Understanding the Assumptions and Their Pilot Plant Implications
The McCabe‑Thiele method rests on two major simplifications. A well‑instrumented pilot plant can either validate their applicability or reveal deviations.
Constant Molal Overflow
The method assumes constant molar vapor and liquid flow rates in each section—the heat of vaporization is constant and heat losses are negligible. In a pilot plant, this demands steady‑state operation and minimal heat transfer through the column walls. Modern pilot columns use thermal insulation jackets and precise flow controllers to approach this condition, enabling a clean comparison with theory.
Adiabatic Operation and Steady State
Beyond constant overflow, the method assumes no heat loss across stages and a stable feed. Any thermal gradient or transient will shift the apparent operating lines. Pilot plants equipped with temperature sensors at every tray allow operators to confirm that the column is isothermal enough to uphold the assumptions. When deviations occur, they signal heat loss or inappropriate feed temperature—both valuable learning points.
Understanding the Trade‑offs
Every parameter you set on a pilot plant using the McCabe‑Thiele method carries consequences. Objectively recognizing these limitations prevents misapplication.
The Reflux Ratio Trade‑off
A high reflux ratio reduces the number of theoretical stages required, but it increases reboiler energy consumption and reduces distillate product rate. In a pilot setting, you must balance stage count (capital cost) against utility cost. Visualizing how increasing reflux steepens the rectifying line—and shrinks the stage count—makes this economic tension tangible.
The Feed Location Sensitivity
Optimizing the feed tray from the diagram produces the lowest stage count, but real trays have finite efficiency. A slight misplacement might cost more stages than predicted. Additionally, feeding at a non‑optimal location can create a pinch zone that demands a higher reflux to meet purity targets, inflating energy use.
Limits of the Graphical Method
The McCabe‑Thiele method is strictly for binary mixtures with relatively constant relative volatility. For multi‑component or highly non‑ideal systems, the VLE curve loses its fixed, two‑dimensional meaning. In pilot plants handling near‑azeotropic mixtures, the method’s accuracy fades, reminding users that it is a first‑principles estimate—not a substitute for rigorous simulation.
How to Apply McCabe‑Thiele to Your Pilot Plant
The power of the method depends on your objective. Use it differently depending on your primary focus.
- If your primary focus is process design: Use the McCabe‑Thiele diagram to determine the minimum reflux ratio, theoretical stage count, and optimal feed location, then select a practical reflux factor to size your pilot column or to guide a scale‑up.
- If your primary focus is education or troubleshooting: Measure steady‑state compositions, plot the operating lines, and compute overall efficiency; the gap between theoretical and actual trays reveals mass transfer bottlenecks, tray flooding, or heat loss.
- If your primary focus is scale‑up reliability: Convert theoretical stages to HETP for packed columns, then use that HETP value to estimate the height of a larger column operating under similar fluid dynamics.
Mastering the McCabe‑Thiele method on a pilot plant bridges the gap between idealized thermodynamics and the messy, instructive reality of separation—giving you the confidence to predict, diagnose, and optimize any binary distillation.
Summary Table:
| Design Parameter | McCabe-Thiele Determination | Pilot Plant Application & Significance |
|---|---|---|
| Theoretical Plates ($n$) | Stepping off stages between VLE and operating lines | Baseline to determine actual physical tray count or packing height. |
| Minimum Reflux ($R_{min}$) | Intersection point of rectifying line, stripping line, and q-line | Defines the thermodynamic limit; used to select optimal operating reflux (1.2 to 1.5 $\times R_{min}$). |
| Optimal Feed Stage | Coordinate where rectifying and stripping operating lines meet | Minimizes total stages; incorrect placement increases energy costs and limits purity. |
| Column Efficiency ($HETP$ / $\eta$) | Ratio of theoretical stages to actual physical trays | Measures real-world mass transfer limitations and hydrodynamic performance. |
Bring Distillation Theory to Life with LABPARK
Bridge the gap between graphical McCabe-Thiele calculations and hands-on industrial reality. LABPARK provides advanced Educational and Vocational Unit Operations Pilot Plants in chemical engineering, bioprocess & biotech, and environmental & water treatment designed specifically for universities, research institutes, and enterprises.
Our custom-built distillation pilot plants feature precise temperature profiling, modular feed ports, and robust instrumentation, allowing your students and researchers to accurately measure column efficiency, calculate HETP, and validate thermodynamic models.
Ready to elevate your engineering lab? Contact LABPARK today to request a quote or discuss your custom system specifications!
Related Products
- Dual-Mode Rectification Pilot Plant for Practical Training Unit Operations
- Continuous Sieve-Plate Distillation Pilot Plant for Unit Operations Laboratory Education
- Multi-Modal Distillation Unit Operations Training Pilot Plant
- Electrolyte Distillation Purification and Formulation Educational Pilot Plant
- Multi-Functional Special Distillation Educational Pilot Plant
People Also Ask
- How does polyphosphate hydrolysis affect scale and corrosion in pilot plants? Essential Monitoring Guide
- How do utility requirements influence pilot plant selection? Avoid Costly Lab Integration Mistakes
- How do predictive thermodynamic models integrate into pilot plants? Bridging Theory and Practice
- Which cross-validation strategy should be selected for pilot plant time-series & batch data? Avoid Data Leakage
- Why do metal ion-catalyzed oxidations of organic substrates use multi-step electron transfer? Pilot-plant insights