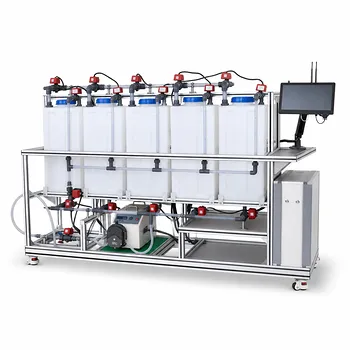
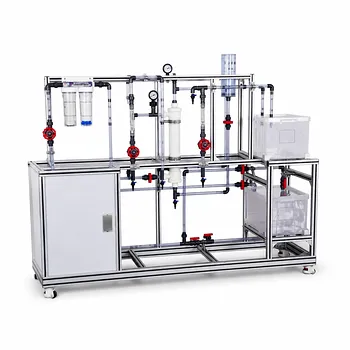
Darcy’s law provides the basic link between flow rate, pressure drop, and porous-media permeability in a pilot plant. By imposing a known flow through a packed bed and measuring the pressure difference across it, engineers can calculate the medium’s intrinsic permeability, assess hydraulic resistance, and determine how flow behavior changes during filtration, clogging, and backwashing. The method applies to sand filters, packed-bed reactors, soil-remediation columns, and other water-treatment modules.
Core takeaway: A pilot plant uses Darcy’s law to turn measured flow and pressure data into a quantitative permeability value. Changes in that relationship reveal bed compaction, clogging, channeling, fluid-property effects, and backwashing performance.
How Darcy’s Law Describes Pilot-Plant Flow
The governing relationship
For fluid flow through a porous bed, Darcy’s law can be written as:
[ \mathbf{v}=-\frac{\kappa}{\mu}\left(\nabla P-\rho\mathbf{g}\right) ]
where:
- (\mathbf{v}) is the superficial velocity, equal to volumetric flow rate divided by the bed cross-sectional area;
- (\kappa) is the Darcy permeability of the medium, in square meters;
- (\mu) is the fluid’s dynamic viscosity;
- (\nabla P) is the pressure gradient;
- (\rho) is fluid density;
- (\mathbf{g}) represents gravitational acceleration.
The sign convention depends on the selected flow direction and coordinate system. In practice, pilot-plant calculations commonly use the magnitude of the pressure drop and include elevation separately through hydraulic head.
Superficial velocity is the practical design variable
Superficial velocity is calculated from:
[ v=\frac{Q}{A} ]
where (Q) is volumetric flow rate and (A) is the bed cross-sectional area.
This velocity is based on the total bed area, including the solid particles. It is therefore lower than the average velocity within the interconnected pore space, often called the interstitial velocity.
Hydraulic head can simplify interpretation
For water-treatment systems, pressure and elevation are often combined as hydraulic head:
[ h=\frac{P}{\rho g}+z ]
Under steady, one-dimensional Darcy flow, the relationship is commonly expressed as:
[ v=-K\frac{dh}{dL} ]
Here, (K) is the hydraulic conductivity, which depends on both the porous medium and the fluid.
The relationship between intrinsic permeability and hydraulic conductivity is:
[ K=\frac{\kappa \rho g}{\mu} ]
This distinction matters because permeability belongs to the medium, while hydraulic conductivity changes when fluid viscosity or density changes.
How a Pilot Plant Measures Permeability
Establish the bed geometry
The engineer first records the column diameter, bed cross-sectional area, packed-bed depth, particle characteristics, and porosity where available.
These measurements define the flow area and the length over which the pressure gradient develops. The bed should be packed consistently because variations in packing can produce misleading permeability values.
Impose a controlled flow
A pump or flow-control system establishes a known volumetric flow rate through the bed.
The test should cover the operating range relevant to the pilot plant, including normal filtration rates and, where appropriate, higher rates associated with backwashing or hydraulic stress testing.
Measure the pressure drop
Pressure taps are installed upstream and downstream of the porous section. The measured differential pressure is:
[ \Delta P=P_{\text{upstream}}-P_{\text{downstream}} ]
The pressure-drop measurement must account for the vertical position of the taps. If the taps are at different elevations, the observed pressure difference includes both frictional resistance and hydrostatic effects.
Calculate the permeability
For a uniform bed with length (L), negligible elevation change, and one-dimensional flow, Darcy’s law gives:
[ \kappa=\frac{\mu v L}{\Delta P} ]
This calculation uses the pressure drop attributable to flow resistance. If the bed is vertical, the gravitational contribution must be included consistently rather than treating the full measured pressure difference as frictional loss.
Plot pressure drop against flow
A useful diagnostic is a plot of (\Delta P) versus (v), or more generally (\Delta P/L) versus (v).
In the Darcy regime, the plot is approximately linear and passes near the origin after correcting for static head. The slope provides the hydraulic resistance:
[ \frac{\Delta P}{L}=\frac{\mu}{\kappa}v ]
A changing slope indicates that the bed’s hydraulic behavior is changing.
What the Results Reveal About Flow Behavior
Clean-bed hydraulic resistance
A clean packed bed establishes a baseline pressure-flow relationship.
This baseline allows operators to distinguish normal resistance from later increases caused by suspended solids, biological growth, chemical precipitates, or bed compaction.
Clogging and fouling
If pressure drop increases at the same flow rate, the bed has become more resistant to flow.
Possible causes include particle deposition, pore blockage, biomass accumulation, or precipitation. A declining apparent permeability is therefore an important operational indicator for filter loading and cleaning requirements.
Channeling and uneven flow distribution
Darcy’s law describes the average relationship through the tested porous section. It does not by itself prove that flow is uniformly distributed.
Channeling can allow some regions to carry excessive flow while other regions receive insufficient treatment. Pressure measurements should therefore be supported by flow-distribution observations, tracer tests, or sampling from multiple locations when treatment performance is critical.
Bed compaction and structural changes
Mechanical compression or rearrangement of the media can reduce pore volume and alter flow paths.
The resulting permeability decrease may appear as a higher pressure drop at unchanged flow. Comparing measurements before and after operation, vibration, loading, or backwashing helps identify these structural changes.
Fluid-property effects
For the same medium and flow regime, pressure drop is proportional to fluid viscosity:
[ \Delta P \propto \mu ]
A more viscous liquid requires a larger pressure gradient to achieve the same superficial velocity. Temperature correction is therefore important in pilot testing because water viscosity changes with temperature.
The Microstructural Basis of Permeability
Pore size and flow resistance
At the pore scale, flow resistance is strongly affected by pore dimensions. An idealized cylindrical capillary is described by the Hagen-Poiseuille relationship:
[ Q=\frac{\pi \Delta P_l d^4}{128\mu l} ]
where (d) is the pore diameter, (l) is the flow-path length, and (\Delta P_l) is the pressure drop along that path.
The fourth-power dependence on pore diameter shows why small reductions in effective pore size can produce substantial increases in resistance.
Porosity is important but not sufficient
Permeability depends on porosity, but porosity alone does not determine how easily fluid flows.
Two media can have similar void fractions but different permeability because their pores differ in size distribution, connectivity, tortuosity, and surface structure. Particle shape and packing arrangement also influence the effective flow paths.
Linking laboratory measurements to media selection
Measured permeability helps compare candidate filter media, support layers, catalyst beds, and remediation materials.
It also supports evaluation of whether a proposed bed can deliver the required treatment flow without exceeding available pump head or producing unacceptable pressure loss.
Using Darcy’s Law for Backwashing Analysis
Establish the clean-bed reference
Before evaluating backwashing, operators should measure the pressure-flow relationship of the clean or acceptably conditioned bed.
This reference provides a target for post-backwash recovery. A bed that does not return toward its baseline resistance may retain deposits or may have undergone permanent structural change.
Compare resistance before and after cleaning
At a selected test flow, compare the pressure drop before backwashing, immediately after backwashing, and during subsequent operation.
A substantial recovery indicates that removable deposits were responsible for much of the resistance. Limited recovery suggests irreversible fouling, compaction, media loss, or inadequate backwash conditions.
Evaluate upward flow conditions
Backwashing typically reverses the flow direction and may expand or agitate the bed.
Darcy’s law remains useful for describing the relationship between flow and pressure gradient while the bed structure is stable. During strong expansion, however, porosity and bed geometry change, so the permeability calculated from a fixed-bed assumption should be treated as an apparent or condition-specific value.
Understanding the Trade-offs
Darcy flow has a defined operating range
Darcy’s law is most reliable for slow, viscous, approximately laminar flow through a stable porous structure.
At higher velocities, inertial effects can become important, and the pressure drop may no longer be proportional to velocity. A non-linear pressure-flow curve should not automatically be forced into a Darcy permeability calculation.
Pressure drop is not caused by the bed alone
Valves, screens, distributors, tubing, fittings, and pressure taps can contribute to the measured pressure loss.
Pilot tests should characterize these components separately or use measurements that isolate the packed section. Otherwise, the calculated permeability may be artificially low.
Local measurements may not represent the entire bed
A single upstream and downstream pressure difference provides an average result over the tested length.
It may not reveal localized clogging, preferential flow, dead zones, or maldistribution. Multiple pressure taps and spatial sampling are justified when the bed is heterogeneous or treatment performance varies significantly across the column.
Permeability is not a universal constant under all conditions
The intrinsic permeability of a rigid, single-phase medium is often treated as constant, but real pilot beds may change during operation.
Media expansion, compression, fouling, particle migration, gas entrapment, and chemical alteration can all change the effective flow relationship. Report the operating condition, fluid properties, bed state, and measurement method with every permeability value.
Making the Right Choice for Your Goal
Use Darcy’s law as a measured operating relationship, not merely as a theoretical equation.
- If your primary focus is permeability characterization: Measure flow rate, pressure drop, bed length, area, viscosity, and elevation carefully, then calculate (\kappa) from the corrected pressure gradient.
- If your primary focus is filter operation: Track pressure drop at a fixed flow rate over time to identify clogging, fouling, and the appropriate backwash trigger.
- If your primary focus is backwash efficiency: Compare the bed’s pressure-flow curve before and after backwashing to quantify hydraulic recovery.
- If your primary focus is scale-up: Use the measured permeability and hydraulic resistance together with the proposed bed geometry, fluid properties, and design flow rate.
- If your primary focus is diagnosing abnormal flow: Check for nonlinearity, distributor losses, channeling, compaction, and changes in fluid viscosity before attributing all pressure loss to the porous medium.
A carefully designed Darcy-law test converts pilot-plant observations into defensible decisions about media performance, hydraulic capacity, fouling, and treatment reliability.
Summary Table:
| Evaluation area | Key measurement or insight |
|---|---|
| Permeability | Calculate intrinsic permeability from flow rate, pressure drop, bed length, area, and viscosity. |
| Hydraulic conductivity | Relate flow to hydraulic head while accounting for fluid density, viscosity, and gravity. |
| Clean-bed performance | Establish a baseline pressure-flow relationship for comparison during operation. |
| Clogging and fouling | Identify rising hydraulic resistance caused by solids, biomass, precipitates, or pore blockage. |
| Channeling | Combine pressure data with tracer tests, spatial sampling, or flow-distribution checks. |
| Bed compaction | Detect reduced pore volume and permeability after loading, vibration, or structural rearrangement. |
| Backwashing | Compare pressure-flow curves before and after cleaning to measure hydraulic recovery. |
| Scale-up | Use measured permeability and resistance to assess pump head, media selection, and treatment capacity. |
| Test limitations | Correct for elevation, fittings, distributors, screens, temperature, non-Darcy flow, and changing bed structure. |
Improve Pilot-Plant Performance with LABPARK
Need reliable data for porous-media flow, filtration, or backwashing? Contact LABPARK to discuss an Educational or Vocational Unit Operations Pilot Plant tailored to your objectives. LABPARK supports universities, research institutes, and enterprises with pilot plants for chemical engineering, bioprocess and biotech, and environmental and water treatment applications.
Our systems help you measure flow rate, pressure drop, permeability, hydraulic resistance, fouling, bed compaction, and backwashing recovery under controlled operating conditions. Use dependable experimental data to select media, validate treatment performance, train students and operators, troubleshoot hydraulic problems, and make better scale-up decisions.
Related Products
- Electrochemical Water Treatment Educational Unit Operations Pilot Plant
- Multifunctional Membrane Separation Educational Pilot Plant with Ultrafiltration, Nanofiltration, Reverse Osmosis
- Ultrafiltration Membrane Separation Educational Pilot Plant
- Thermal Desorption Exhaust Gas and Tail Water Treatment Educational Pilot Plant
- Multi-Functional Membrane Separation Educational Pilot Plant for Unit Operations Lab
People Also Ask
- What design features do educational electrochemical pilot plants utilize to manage gas liberation and water loss?
- How can unit operations pilot plants show lead-acid concentration vs state of charge? Real-time monitoring guide.
- How do educational electrochemical pilot plants scale up electrolysis? Master industrial engineering.
- How to Estimate Sulfate in Water Treatment Pilot Plant Deposits: Gravimetric Guide
- How can foaming be managed during steam generation experiments in water treatment unit operations pilot plants? Tips