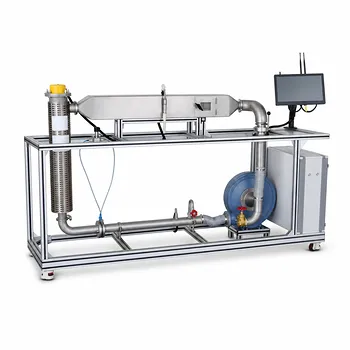
Understanding multi-phase equilibrium isn't just an academic exercise—it's the strategic blueprint for designing safe, insightful, and scalable pilot plant experiments. When you know, for example, the precise four-phase conditions (hydrocarbon liquid (L_1), aqueous liquid (L_2), gas (G), and hydrate (H)) in a methane-isobutane-water system, you can pinpoint the exact temperature, pressure, and composition ranges where hydrates will form, liquids will split, or a stable vapor will coexist. This knowledge allows you to select operating conditions that intentionally probe those critical phase boundaries, place sampling points exactly where the most valuable composition data will be found, and validate the thermodynamic models you'll later use for full-scale process design.
Designing a pilot plant experiment for multi-phase hydrocarbon-water systems without a deep grasp of the phase equilibrium is like building a house without a blueprint. The fundamental insight is that the phase diagram dictates your experimental layout: where you can safely operate, where you must sample, what you will measure, and how you will mathematically interpret the results. This understanding transforms a trial-and-error approach into a targeted, validated learning loop between theory and physical operation.
The Role of Phase Equilibrium in Pilot Plant Design
Phase equilibrium is the single most requested category of engineering data—70% of all design data requests revolve around it. Pilot plants exist to generate that data under controlled, scalable conditions. A thorough understanding of the multi-phase behavior directly shapes every design decision.
The Thermodynamic Criterion Anchors Your Measurements
At constant temperature and pressure, equilibrium requires the chemical potential (or fugacity) of each component to be equal across all coexisting phases. In a distillation or multi-phase flow setup, this means ( f_i^{L_1} = f_i^{L_2} = f_i^G = f_i^H ). Knowing this tells you that by experimentally measuring the temperature, pressure, and composition of just one or two phases, you can validate whether the entire system has truly reached equilibrium—and, if you're using a model like Peng–Robinson with fitted binary interaction parameters, you can predict the others. This is why sampling ports must be placed where they can capture representative, equilibrated streams free from entrainment or thermal gradients.
Phase Envelopes Define Your Experimental Boundaries
Plotting the phase envelope of a methane-isobutane-water system reveals distinct regions: vapor only, vapor-liquid, liquid-liquid, and the hydrate formation zone. Before you ever build a rig, this map tells you the safe operating window—pressures and temperatures where you avoid catastrophic hydrate plugging—and the narrow P-T paths where four-phase equilibria occur. Armed with this map, you can design a heating and pressure-control system that deliberately nudges your pilot column or stirred cell into the region of interest, guaranteeing you'll see the phenomena you aim to study.
Mapping the Phase Envelope: From Theory to Experiment
Moving from a computer-generated phase diagram to a functioning pilot plant requires translating thermodynamic knowledge into hardware decisions.
Selecting Representative Model Systems
A system like methane-isobutane-water is chosen precisely because it exhibits a rich phase behavior—vapor-liquid-hydrate equilibria and liquid-liquid immiscibility—that mimics real natural gas streams. Educators and researchers use this complexity to demonstrate the limits of ideal-solution laws and the necessity of activity coefficients and equations of state. Understanding the equilibrium means you can predict the dominant non-idealities (for example, the strong mutual insolubility of water and hydrocarbons or the hydrate-forming tendency at high pressure/low temperature) and then design experiments that isolate each effect.
Placing Sampling Points to Capture All Phases
In a multi-phase pilot column or flow cell, phases can separate in ways that are not visually obvious. A four-phase system might present as a heavy aqueous liquid, a lighter hydrocarbon liquid, a gas headspace, and solid-like hydrate particles. Based on equilibrium predictions, you know that a single bottom drain might only capture the dense aqueous phase, while the hydrocarbon liquid floats above it. You therefore need multiple, strategically positioned sample ports at different heights and locations, each equipped with careful temperature control to prevent phase change during extraction. The model tells you what composition to expect at each port, enabling you to immediately spot leaks, clogging, or non-equilibrium sampling.
Validating Thermodynamic Models with Real Data
A pilot plant’s greatest value is in providing experimental truth against which theoretical models are tested and refined.
Regression Turns Raw Data into Reliable Parameters
The Peng–Robinson equation of state alone cannot accurately predict the mutual solubility of water and hydrocarbons without a tuned binary interaction parameter (( k_{ij} )). These parameters are not universal constants; they are specific to each pair and become less reliable as the number of components grows. By running a pilot plant at well-chosen equilibrium states—say, along the three-phase hydrate-vapor-liquid water line—you generate highly targeted composition data. Feeding this into a process simulator’s regression routine optimizes the ( k_{ij} ) value for water-methane or water-isobutane, dramatically improving the model’s predictive power for process design. This is how research pilot plants bridge the gap between molecular-level physics and industrial-scale simulations.
Confirming Fugacity Equality Across All Phases
Experimental data serves as a hard reality check. A common educational and research exercise is to measure the temperature, pressure, and composition of coexisting phases, then calculate the fugacity of each component in each phase using the PR equation (or an activity coefficient model for the liquid). If the calculated fugacities are not equal within experimental error, the model’s assumptions—or the sample itself—need scrutiny. This direct comparison between theoretical fugacity coefficients and laboratory measurements is what reinforces the student’s understanding of Gibbs energy minimization and exposes the limitations of even sophisticated models when applied to highly asymmetric mixtures like water and supercritical hydrocarbons.
Four-Phase Systems: The Ultimate Test for Process Understanding
Multi-phase equilibrium education often culminates in the study of a four-phase ( L_1L_2HG ) system. It is the “final exam” of thermodynamic pilot plant design.
Teaching the Limits of Traditional Separations
In natural gas processing, a stream containing methane, isobutane, and water can simultaneously form a hydrocarbon-rich liquid, a water-rich liquid, a vapor, and a solid hydrate—all at conditions routinely found in subsea pipelines. An experimental setup designed to demonstrate this shows students why a simple flash drum cannot separate all components; you need a sequence of unit operations (dehydration, low-temperature separation, inhibitor injection). The pilot plant experiment, guided by phase equilibrium predictions, visibly demonstrates the consequence of crossing into the hydrate region: rapid solid formation and plugging. This visceral lesson is impossible to convey with a computer screen alone and makes the theory unforgettable.
Validating Hydrate Equilibrium Curves
The hydrate phase occupies a specific, narrow region on the phase diagram. Experimentally determining that boundary requires a precise, slow stepwise change in pressure or temperature while monitoring turbidity, pressure drop, or heat release. Knowing the predicted hydrate dissociation curve (from the PR model with water-specific binary interactions) tells you where to start your search and how small your increments should be. The pilot plant then becomes a tool to refine those equilibrium curves for mixed gas systems, data that directly feeds into flow assurance software used in industry.
Understanding the Trade-offs and Pitfalls
No experiment designed around phase equilibrium is free of challenges. Recognizing these limitations is part of the expertise.
- Achieving true equilibrium takes time. In a laboratory setting, a stirred cell may reach equilibrium in hours; in a flowing pilot plant, you may never reach a global equilibrium state. This forces a trade-off between relevance to process dynamics and the purity of the thermodynamic measurement.
- Sample withdrawal can destroy the evidence. Extracting a liquid sample from a high-pressure, hydrate-forming system can flash vapor or form hydrate within the sample line if temperature is not rigorously maintained. The best thermodynamic insight may be lost if sampling protocols are not designed with the phase envelope in permanent view.
- Binary interaction parameters have limited transferability. The parameters you fit for methane-isobutane-water may not accurately predict behavior when small amounts of heavier hydrocarbons or salts are present. The pilot plant experiment must be designed to test the model’s sensitivity to these additional components, not just validate a single set of parameters.
- Safety hazards are concentrated at phase boundaries. The most interesting thermodynamic points—near the hydrate dissociation line or the critical point—are often the least safe. Designing a heating/cooling system that can rapidly exit the hydrate stability zone without overpressure is a direct consequence of understanding the equilibrium diagram.
How to Apply This to Your Educational or Research Program
The way you leverage phase equilibrium knowledge depends on your primary goal.
- If your primary focus is undergraduate education: Design the experiment to visually display multiple phases. Use a transparent equilibrium cell and slowly cycle temperature through the hydrate formation boundary. The learning outcome is the direct connection between the Gibbs phase rule and what the student witnesses.
- If your primary focus is rigorous model development: Run the pilot plant as a static equilibrium cell. Hold the system at each predetermined P-T coordinate for hours, sample all phases without flashing, and use the data to regress binary interaction parameters. The goal is high-precision data that can improve industrial simulators.
- If your primary focus is process scale-up: Operate the pilot plant in a continuous flow mode that mimics the commercial unit. Use the phase diagram to select a steady-state operating point that is thermodynamically stable but challenging (e.g., just outside the hydrate region) and then measure separation efficiency, flow patterns, and energy consumption. The equilibrium data validates your simulation, but the operational data validates your process design.
By mastering the phase equilibrium of systems like methane-isobutane-water, you transform your pilot plant from an expensive piece of hardware into a trusted, data-rich tool that accurately predicts the behavior of complex industrial processes before a single cubic meter of steel is ordered.
Summary Table:
| Key Design Aspect | Role in Pilot Plant Experiments | Practical Benefit |
|---|---|---|
| Thermodynamic Criterion | Uses fugacity equality ($f_i^{L_1} = f_i^{L_2} = ...$) to verify phase equilibrium. | Prevents sampling errors and confirms true physical equilibrium. |
| Phase Envelopes | Maps out safe operating windows (T, P, and composition boundaries). | Avoids hazardous regions (e.g., hydrate plugging) and target specific phases. |
| Strategic Sampling | Places sample ports at varying heights based on phase density. | Captures representative, un-entrained streams of coexisting phases. |
| Model Validation | Regresses experimental data to optimize binary interaction parameters ($k_{ij}$). | Improves the predictive accuracy of thermodynamic models (e.g., Peng-Robinson). |
Scale Up Your Chemical Engineering Research with LABPARK
Translating complex thermodynamic theory into reliable physical operation requires precise, robust equipment. LABPARK designs and manufactures high-quality Educational and Vocational Unit Operations Pilot Plants specializing in chemical engineering, bioprocess & biotech, and environmental & water treatment.
We help universities, research institutes, and enterprises build flexible, safe, and data-rich experimental systems that make multi-phase equilibrium visible and measurable.
Ready to elevate your laboratory capabilities and ensure accurate thermodynamic modeling? Contact us today to discuss your pilot plant requirements!
Related Products
- Binary System Vapor Liquid Equilibrium Data Determination Educational Unit Operations Pilot Plant
- Ternary Liquid-Liquid Equilibrium Educational Pilot Plant
- Carbon Dioxide PVT Curve Determination Educational Unit Operations Pilot Plant
- Two Phase Flow Pattern Velocity Resistance Measurement Educational Pilot Plant
- Fluid Friction Resistance Determination Educational Unit Operations Pilot Plant
People Also Ask
- How can pilot plants assist in validating VLE models? Bridge theory and physical reality.
- Why Collect Isothermal vs. Isobaric VLE Data? Key Pilot Unit Advantages
- How Do Equations of State Predict VLE in Pilot Plants? Optimize Your Separation Design
- How do intermolecular forces and molecular kinetic energy govern gas liquefaction and vaporization? Explore VLE pilot plants
- For VLE Experiments: Fugacity vs. Activity Coefficient Method Selection Criteria