The size of a bubble dictates how efficiently it transfers oxygen to the surrounding liquid. In gas-liquid bioreactors, the mass transfer coefficient (kL) is not a constant—it changes with bubble diameter. For bubbles smaller than 2.5 mm, kL is dominated by a stagnant spherical boundary layer, yielding a baseline value that increases slightly with density-driven convection. For bubbles larger than 2.5 mm, the surface becomes mobile and internal circulation boosts mass transfer, following a completely different correlation. In chemical engineering lab experiments, you calculate this by measuring the bubble's Sauter mean diameter and fluid properties, then applying the appropriate Sherwood number correlation—Sh = 2.0 + 0.31·Gr1/3·Sc1/3 for small rigid bubbles, and Sh = 0.42·Gr1/3·Sc1/2 for large mobile ones—and finally extracting kL from Sh = kL·d/D.
The true leverage point for optimizing a bioreactor is not just kL, but the volumetric mass transfer coefficient (kLa). Bubble size affects both sides of this product: it directly alters kL through the Sh correlations and indirectly determines the interfacial area a via gas holdup and the Sauter mean diameter. Understanding how to isolate and calculate these components in a pilot plant is the foundation of reliable scale-up.
The Physics Connecting Bubble Size and Mass Transfer
Mass transfer from a gas bubble into a liquid is governed by the boundary layer surrounding the bubble. The thickness and mobility of that layer—both strong functions of bubble size—set the resistance to oxygen diffusion.
The Critical 2.5 mm Threshold: Rigid vs. Mobile Bubbles
Bubbles under about 2.5 mm behave as rigid spheres because surface tension immobilizes their interface. In this regime, the minimum Sherwood number is 2.0, corresponding to pure molecular diffusion around a sphere. The additional term 0.31·Gr1/3·Sc1/3 accounts for the gentle convective drift caused by density differences (buoyancy).
When bubbles exceed 2.5 mm, the interface becomes mobile and internal gas circulation kicks in. The rigid-sphere baseline vanishes, replaced entirely by the correlation Sh = 0.42·Gr1/3·Sc1/2. Because the Schmidt number exponent drops from 1/3 to 1/2, the effect of viscosity and diffusivity changes noticeably—and the mass transfer coefficient becomes more sensitive to fluid properties.
Demystifying the Sherwood, Grashof, and Schmidt Numbers
These dimensionless groups pack the entire physics into a scalable form.
- Sherwood (Sh = kLd/D): Represents the ratio of convective mass transfer to diffusive mass transfer. It is the key output—solve for kL once Sh is known.
- Grashof (Gr = g·d³·∆ρ / (ρ·ν²)): Quantifies the buoyancy-driven flow arising from density differences (∆ρ) between the liquid and the gas. The diameter term cubed means large bubbles generate disproportionately stronger natural convection.
- Schmidt (Sc = ν/D): The momentum diffusivity vs. mass diffusivity. For oxygen in water, Sc is large (~400), placing mass transfer deep in the convection-augmented regime.
In the lab, you calculate these numbers from measured liquid density (ρ), kinematic viscosity (ν), diffusion coefficient (D), and the bubble’s Sauter mean diameter (d).
Calculating Mass Transfer in the Laboratory
Pilot-plant courses move students beyond theory by letting them measure every variable that feeds these correlations. The typical workflow bridges measured bubble size and volumetric oxygen transfer measurements.
Step-by-Step: From Measured Bubble Size to kL
- Determine the Sauter mean diameter (ds). Measure the bubble size distribution using high-speed photography or by calculating it from gas holdup and pressure-drop data. For sparger-specific systems, apply Calderbank’s correlation (two-phase nozzles) or the Akita-Yoshida correlation (perforated plates) to estimate ds from gas velocity and liquid properties.
- Calculate the dimensionless groups. With ds, ρ, ν, and D, compute Gr and Sc.
- Select the correct Sh correlation. Use the 2.5 mm threshold to pick the rigid or mobile bubble equation.
- Solve for kL. Rearranging Sh = kL·ds/D gives kL = Sh·D / ds.
- Link to volumetric performance. Measure gas holdup (εG) via the volume expansion method. Calculate interfacial area a = 6·εG/ds. The predicted volumetric mass transfer coefficient is kLa = kL · a. Compare this to experimental kLa from dynamic gassing-out or sulfite oxidation methods to validate the model.
Accounting for Non-Ideal Broths and Coalescence
Real fermentation broths often exhibit non-Newtonian viscosity. High apparent viscosity suppresses turbulence and encourages bubble coalescence, leading to larger bubbles than those predicted by clean-water correlations. This reduces both kL and a, slashing kLa.
In the lab, you can mimic this by adding viscosity-enhancing agents and observing how the Sauter mean diameter shifts. Students learn that sparger selection must compensate for broth rheology—finer orifices and higher gas velocities can counteract coalescence and keep bubble size in the small, high-performance regime.
Understanding the Trade-offs
Pushing bubble size down indefinitely is not a panacea. The interplay between kL, interfacial area, and fluid dynamics introduces practical limitations that every chemical engineering student must confront.
The Pitfall of Ignoring Gas Holdup
Tiny bubbles boost a through their high surface-to-volume ratio, but they also increase gas holdup εG. Beyond a certain point, excessive holdup causes bubble crowding, promotes coalescence, and can even induce slugging in the column. The gain in a flattens, and mixing deteriorates. Lab experiments often reveal an optimal sparger power level where kLa peaks, not where bubble size is smallest.
Scale-Up Discrepancies: Why Column Diameter Matters
The Sherwood correlations are geometry-independent, but the bubble size itself—and therefore kLa—is not. In columns smaller than 0.60 m diameter, wall effects influence the Bond and Froude numbers, altering bubble rise velocity and size distribution. Scale-up correlations like Akita and Yoshida’s show that the column diameter term becomes irrelevant only once the column exceeds 0.60 m; for pilot-scale vessels, you substitute a constant 0.60 m. Students running lab-scale columns (<0.60 m) must explicitly account for this geometric factor, or their predictions will underestimate industrial performance.
Making the Right Choice for Your Bioreactor Experiment
Your experimental design—and the driving goal—determines how deeply you need to dissect bubble size effects.
- If your primary focus is measuring intrinsic kL: Use high-speed imaging to get an accurate Sauter mean diameter, then apply the 2.5 mm threshold correlation directly. Compare the calculated kL with the value derived from a separately measured kLa and a.
- If your primary focus is predicting fermenter oxygen transfer: Measure gas holdup and bubble size simultaneously. Compute kLa from first principles and validate against the dynamic sulfite oxidation rate. Pay particular attention to the broth’s apparent viscosity.
- If your primary focus is scale-up from pilot to production: Use the Akita-Yoshida or Calderbank correlations for bubble size, but remember to cap the column diameter at 0.60 m. Then calculate Sh and kL using the same dimensionless framework—this ensures your model stays consistent as you move from bench to industrial scale.
A single bubble’s diameter cascades through density-driven convection, interfacial area, and column hydrodynamics to set the ultimate oxygen delivery rate. Master the dimensionless correlations and the critical 2.5 mm transition, and you turn a lab-scale bubble column into a reliable blueprint for industrial bioreactor design.
Summary Table:
| Bubble Size ($d$) | Interface Behavior | Sherwood Correlation ($Sh$) | Dominant Mass Transfer Driver |
|---|---|---|---|
| < 2.5 mm | Rigid sphere, stagnant boundary layer | $Sh = 2.0 + 0.31 \cdot Gr^{1/3} \cdot Sc^{1/3}$ | Molecular diffusion + gentle buoyancy drift |
| > 2.5 mm | Mobile interface, internal circulation | $Sh = 0.42 \cdot Gr^{1/3} \cdot Sc^{1/2}$ | Convection-dominated (fluid property sensitive) |
Bring Chemical Engineering Concepts to Life with LABPARK
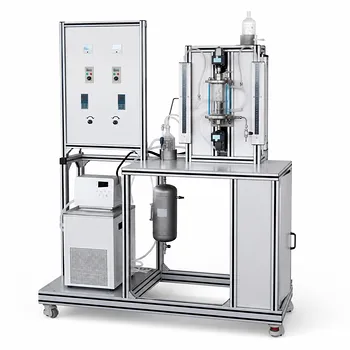
Empower your students and researchers with hands-on learning. LABPARK provides advanced Educational and Vocational Unit Operations Pilot Plants across chemical engineering, bioprocess & biotech, and environmental & water treatment. Specifically designed for universities, research institutes, and enterprises, our systems make it easy to study mass transfer, bubble dynamics, and scale-up phenomena in real-world scenarios.
Ready to elevate your engineering lab's training capabilities? Contact us today to request a quote or custom solution!
Related Products
- Dual-Drive Stirred Gas-Liquid Mass Transfer Coefficient Determination Pilot Plant
- Packed Bed Absorption Educational Unit Operations Pilot Plant
- Two Phase Flow Pattern Velocity Resistance Measurement Educational Pilot Plant
- Micro-Scale Gas-Solid Catalytic Reaction Educational Pilot Plant
- Ternary Liquid-Liquid Equilibrium Educational Pilot Plant
People Also Ask
- How does column packing affect absorption intensification, and how is it evaluated experimentally?
- Why Compare Membrane-Reservoir Models with Pilot Plant Data? Ensure Successful Process Scale-Up
- Why is pilot plant gas absorption lower than isothermal model predictions? Interfacial heating explained.
- Which interphase forces dominate gas dispersion in stirred reactors? Master Gas Holdup Models
- What key factors influence the rate of diffusion in liquids? Optimize Mass Transfer Pilot Plant Design